Encardio Moniterra Group is all set to bring about a revolution in sustainable structural deformation monitoring with its unique software – OPSIS. Let’s have a look into this incredible application that would be a real game-changer in this field.
What Is Laser Scanning?
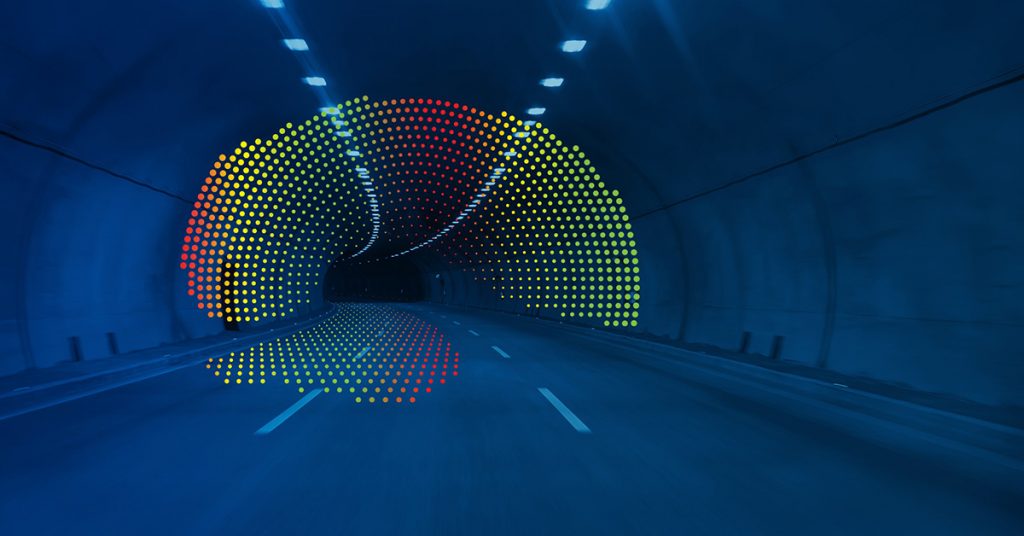
Figure 1: Laser Scanning Of A Tunnel
Laser Scanning is a technique that automatically monitors and collects the data in real-time with 3-dimensional surface coordinates of an object in a normal grid. It is considered as a rapid and reliable surveying method as it collects data in a static, stop-and-go, or kinematic mode. The exported section profiles can be used to monitor deformations or displacements from the point where a cloud is produced.
A Laser Scanner is an instrument developed to determine displacements or deformations of a surface. Within minutes, it collects a dense point cloud getting a full detailed description of the monitored object.
Despite the fact that this method is fast, contactless, and complete, scanning was not extensively used for three reasons:
- Cost of purchasing a laser scanner
- The instrument’s specified accuracy
- Handling of such a large amount of data.
However, in the last couple of years, laser scanners have been accurate and affordable.
Why OPSIS For Laser Scanning?
The terrestrial Laser Scanner or LiDAR has been used in the fields of surveying engineering and geomatics extensively as the evolution and improvements in its technology allowed the collection of increasingly more accurate data sets.
Despite the benefits of LiDAR over other data-collecting methods, such as the remarkably higher amount of data collected for the same area in reduced periods without the need to place targets, the field of Deformation Monitoring has remained as one of the few unable to implement this technology.
The reason behind this is none other than the vast amounts of data that LiDAR provides. However, this advantage becomes a weakness at the post-processing stage, where the analysis of large data sets acquired regularly presents a challenge.
Hence, OPSIS was developed to overcome the impediments previously described. The idea within its core is to perform operations over the raw data provided by the LiDAR to get a significantly smaller data set.
For the results obtained from the analysis of this sub-dataset to be equivalent to those we would obtain evaluating the original, the operations involved must ensure to preserve the spatial information contained within the input data.
How Does OPSIS Work?
LiDAR provides us with multidimensional spatial information in the form of point clouds. After going through a filtering process to eliminate the outliers or noise, the first calculation performed is the projection of each point of said cloud over a mathematically defined surface.
Determination of the type of surface and its defining parameters is done based on best-fit adjustment to the specific point cloud. From this moment on, we can display our three-dimensional data on a two-dimensional representation, although the volume of data we have to work with remains the same, as we still gather the same number of points defined by 3 parameters (coordinates on the projection surface and distance).
To resolve the obstacles presented by the extensive amount of data, the second transformation of the data is performed. Said transformation is the tessellation of the 2D representation using a square grid of adjustable size. The points contained in each cell are the subject of a statistical analysis focused on the distance from each point to the surface, obtaining a mean deviation value for each grid’s cell. Setting a maximum deviation value, the cells are classified into two categories, accepted and rejected. The values of those accepted cells are the subject of the deformation analysis, thus achieving the goal of obtaining a reduced data set to analyze.
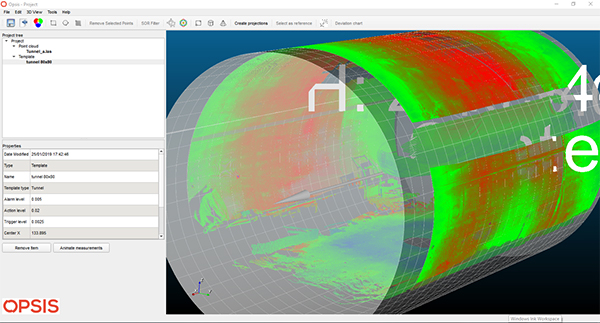
Figure 2: 3D Tunnel Template Creation Using OPSIS
The task of monitoring the deformations or displacements of the scanned objects to perceive possible changes using OPSIS comes down to processing the subsequent point clouds obtained in different epochs using the same projection surface and grid obtained as the best fit for the initial point cloud.
If significant changes in the object’s geometrical form were to occur, variations of the cell’s mean values would make them easily detectable. What is differentiating this approach from the commonly used existing software, is that this is not just a point cloud pair comparison. It is also a linear diagram visualization of the deformation history of each grid cell.
Application Areas of OPSIS
OPSIS software can be used to monitor:
1. Road Pavements: Watch the demo video below on how the OPSIS software analyses laser scanner data of road surfaces and provides you with complete deformation overview maps, time-displacement graphs, and animated images.
2. Airport Runways
3. Nuclear Power Plants
4. High Chimneys
5. Buildings, Monuments: Watch the below demo video on how the OPSIS software analyses laser scanner data of buildings and provides you with complete deformation overview maps, time-displacement graphs, and animated images at a glance.
6. Hydropower Stations/Dams: Watch the below demo video on how the OPSIS software analyses laser scanner data of dams and provides you with complete deformation overview maps, time-displacement graphs, and animated images at a glance.
7. Open Pits, Landslides, and Slopes
8. Refineries, Oil-Tanks
9. High-Rise Buildings
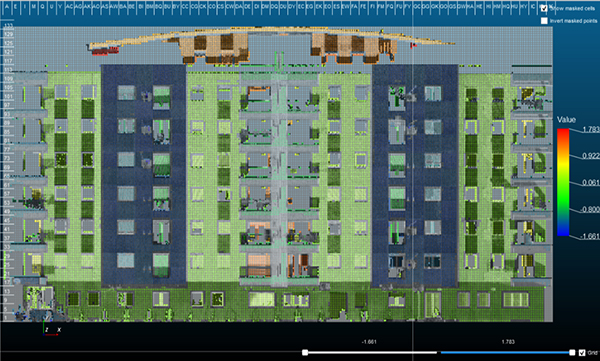
Figure 3: High-Rise Building Projection Using OPSIS
10. Tunnels, Mines: Watch the below demo video on how the OPSIS software analyses laser scanner data of tunnels and provides you with complete deformation overview maps, time-displacement graphs, and animated images at a glance.
11. Bridges, Viaducts
Key Features Of OPSIS:
OPSIS analysis software has several features that make it one of a kind. Some of them include:
- Limitless point cloud comparison
- Full surface deformation maps
- Time-displacement graphs
- Time-lapse animation of deformation maps
- Customization of projection mathematical template and results’ grid
- Multiple templates within the same project
- Scalable graphs
- Custom color scales
- Custom alert, alarm, and action level per template
- Imports .las, .pts, .e57, .ply, .xyz files
- Export in PDF, XML, and CSV format
- OEM noise filtering
- Automatic elimination of points away from the template’s surface
- Just 2 clicks and 2 seconds from importing a point cloud to the viewing of the report.
Benefits Of OPSIS:
1. Save Human Resources
- The software provides the complete coverage of the structure’s surface – monitor in between other installed sensors
- It saves the risk of installing prisms at dangerous locations thereby, saving human life
- The software eliminates possibilities of accidents such as traffic and construction site mishaps
- It provides thorough monitoring data
2. Saves Time
- It eliminates the installation of targets and provides immediate baseline readings.
- It is much faster than total stations and optical 3D measurements
- It provides point cloud comparison results within a few seconds
3. Reduces Cost
- It focuses only on the problematic areas thereby, reducing the cost and time as well.
- It analyses the problem in advance and takes corrective action immediately thus, saving on costly repair work later
- The software eliminates accessibility or installation permits
- It doesn’t hinder the construction work
4. Efficient Performance
- The fast-speed scanning ensures evenly distributed environmental effects – wind speed, solar radiation, temperature, refraction, etc. over the monitoring duration.
- It provides an overview of the total map(s) of deformations.
- The software understands the history of long-term time-displacement graphs.
- It interprets by correlating data with other parameters – wind speed, water table, total pressure, temperature, etc.
OPSIS is indeed an effective, as well as, smart solution that can be used for analyzing Laser Scanning data for effective structural deformation monitoring. This was brief on OPSIS – the deformation analysis software developed by Encardio Moniterra Group with over 57 years of expertise, knowledge, and experience.