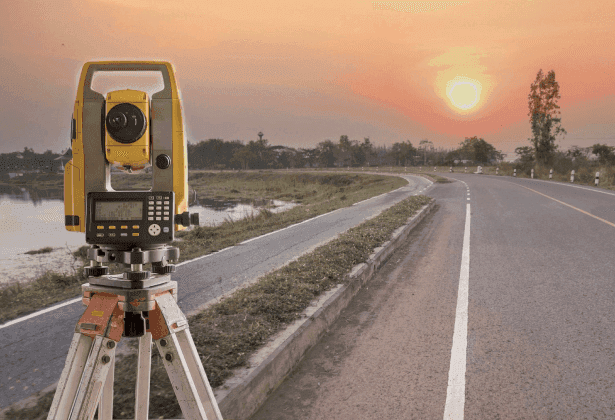


A precision monitoring case study from the Al Marjan Glass Steel Spire in Ras Al Khaimah, where 33 survey campaigns reduced a projected apex deviation of more than 400 mm to a measured 5.1 mm using total station monitoring and classical geometric methods.
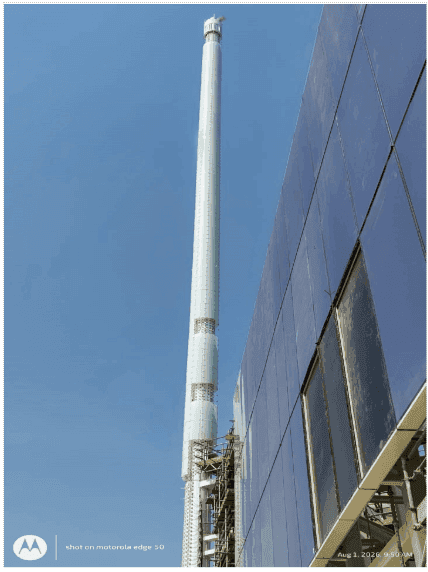
The Al Marjan Glass Steel Spire is a 68.32-metre steel structure comprising ten cylindrical sections — known as blocks — assembled sequentially at height. Its geometry is demanding: a large overall height, a relatively slender profile, and bolted splice connections at every joint. These characteristics make the structure inherently sensitive to verticality deviations that compound progressively from block to block. A small angular offset at a low level translates, at the apex, into a disproportionately large horizontal displacement.
The initial full survey, carried out on 2 June 2026 (VSR-011), revealed a projected apex deviation exceeding 400 mm — an outcome unacceptable for a structure of this scale and architectural significance. The source of the deviation was traced to the geometry of the lower blocks, which had been installed with a tilt that propagated upward through the stack.
The Approach
Rather than deploying complex 3D scanning systems or specialist verticality software, we selected a methodology rooted in classical analytical geometry: the chord method, validated and complemented by the three-point circle method.
Instrumentation-
All measurements were carried out using a Leica Nova TM60 total station, a high-precision monitoring instrument with an angular accuracy of 0.5″ and sub-millimetre reflectorless measurement capability. Miniature prisms were mounted on purpose-built brackets fixed to the outer surface of each block at two levels — bottom and top — providing two measurement circles per block.
Survey protocol: all campaigns were conducted before 08:00 to avoid atmospheric refraction caused by thermal gradients in temperatures exceeding 40°C. A single afternoon campaign (VSR-026) was conducted with the instrument and data were subsequently declared void — confirming that the morning-only protocol was not a precaution but a necessity.
Each campaign began with a reliability check: all previously measured prism levels were re-observed and compared against the accepted dataset. Any discrepancy exceeding ±1.5 mm triggered investigation before new data were processed.
The Chord Method — Blocks 3 to 9
For each new block installed, three prisms were initially placed around the circumference. The three-point circle method was applied to these three observations to compute the circle's centre and radius directly — with no prior assumptions. The computed radius was then verified against the nominal diameter from the structural drawings, serving as an internal quality check.
Once the radius was confirmed, the ongoing monitoring programme used two prisms per level and the chord method — a simpler, faster, and equally accurate approach for a known, stable radius. Given two prism coordinates (P₁, P₂) and the known radius R, the centre C of the circular cross-section is computed directly from the perpendicular bisector of the chord:
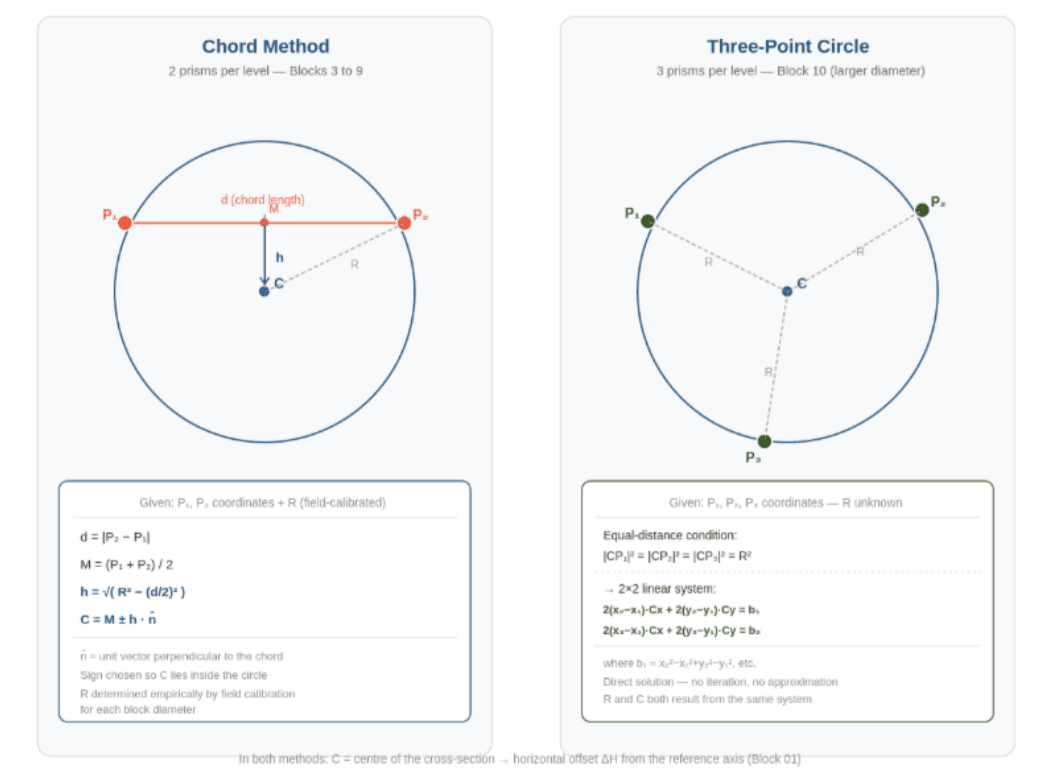
Typology: chord method (left) and three-point circle method (right). Both yield the centre C of the cross-section from prism coordinates alone.
Block 10 has a significantly larger diameter than Blocks 3–9, making the calibrated radius of the lower blocks inapplicable. Three prisms were installed at the top level, and the three-point circle method was applied directly — yielding both the centre and the radius of Block 10 in a single computation. Since Block 10 is only approximately 3 metres tall, and given that any internal tilt over such a short segment would contribute a negligible additional displacement at the apex, no bottom prism level was installed. The top measurement constitutes a direct observation of the apex position.
The Numbers
From 2 June to 28 July 2026, a total of 33 survey campaigns (VSR-011 through VSR-033) were carried out, covering every stage of the installation: initial baseline, corrective interventions, shim operations, and final verification. The dataset spans a surveyed height of 66.16 m above the reference level (Block 01 base).
Campaign consistency: successive campaigns on unchanged blocks agreed within ±1 mm throughout the entire programme — a figure that held across summer temperatures, multiple instrument setups, and five months of construction activity. This consistency was not incidental. It was the product of a fixed methodology, a fixed instrument station, morning-only observations, and a mandatory reliability check at the start of every campaign.
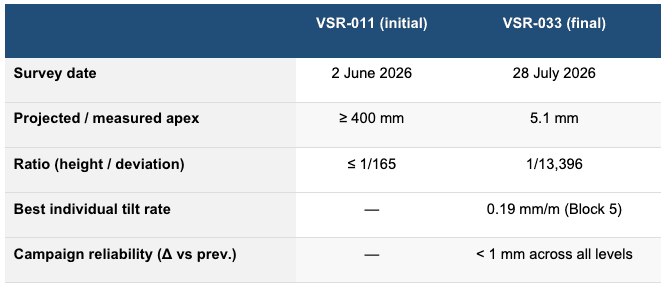
The improvement between VSR-011 and VSR-033- from a projected apex deviation of more than 400 mm to a measured apex position of 5.1 mm represents a reduction of over 98%. It was achieved in 56 days, across 33 survey campaigns, using a total station and a spreadsheet.
The Al Marjan Glass Steel Spire now stands at 68.32 metres with its apex measuring 5.1 mm from the theoretical vertical axis — a ratio of 1:13,396. For context, the tolerances typically cited in precision surveying standards for structures of this type are of the order of 1:1,000 to 1:3,000. The result achieved here is four to thirteen times better than standard specification.
The monitoring programme also produced a secondary result of equal value: a complete, campaign-by-campaign record of the structure's geometry from first installation to final sign-off. Every corrective decision taken during the construction process was based on data that was internally consistent, independently verifiable, and produced the same morning it was measured.
The Lesson
Classical geometry is not an inferior substitute for modern software. It is precise, transparent, and verifiable- qualities that matter acutely when the data are being used to guide a structural correction in real time.
Every step of the computation described in this document can be reproduced with a pen, a piece of paper, and a scientific calculator. There are no hidden assumptions, no proprietary algorithms, and no black boxes. When a discrepancy arose — as it did on 31 July 2026, when an instrument setup error produced results that diverged from the accepted dataset by up to 39 mm — the methodology made it immediately detectable. The raw data told the truth; the geometry confirmed it.
In an industry that trends towards increasingly complex and expensive measurement systems, this project demonstrates that the limiting factor in precision monitoring is not the sophistication of the software. It is the rigour of the method, the consistency of its application, and the discipline to act on what the numbers say — even when the numbers are inconvenient.