

Retrospective InSAR analysis of the Dikwena Chrome TSF identified a distinct shift in deformation approximately 3.5 months before its August 2026 failure demonstrating how satellite monitoring can reveal changes before they become visible on the ground.
SkyWatch | SBAS InSAR | January 2023 – August 2026
This case study is based on publicly available satellite data (ESA Copernicus Sentinel-1 and Sentinel-2) and independent analysis by Encardio Rite. It does not represent, and should not be read as implying, any client relationship with, or endorsement by, Samancor Dikwena Chrome or any other party named herein. The observations below are technical characterisations of satellite-derived deformation data and do not attribute fault, negligence, or responsibility for the failure. The cause of the failure remains subject to the official government investigation referenced below.
What happened
On 13 August 2026, a sidewall of the tailing's storage facility at Samancor Dikwena Chrome near Brits, Northwest, South Africa, failed, releasing tailings into the surrounding area. No fatalities were reported. The incident disrupted nearby infrastructure and prompted a multi-agency government investigation.
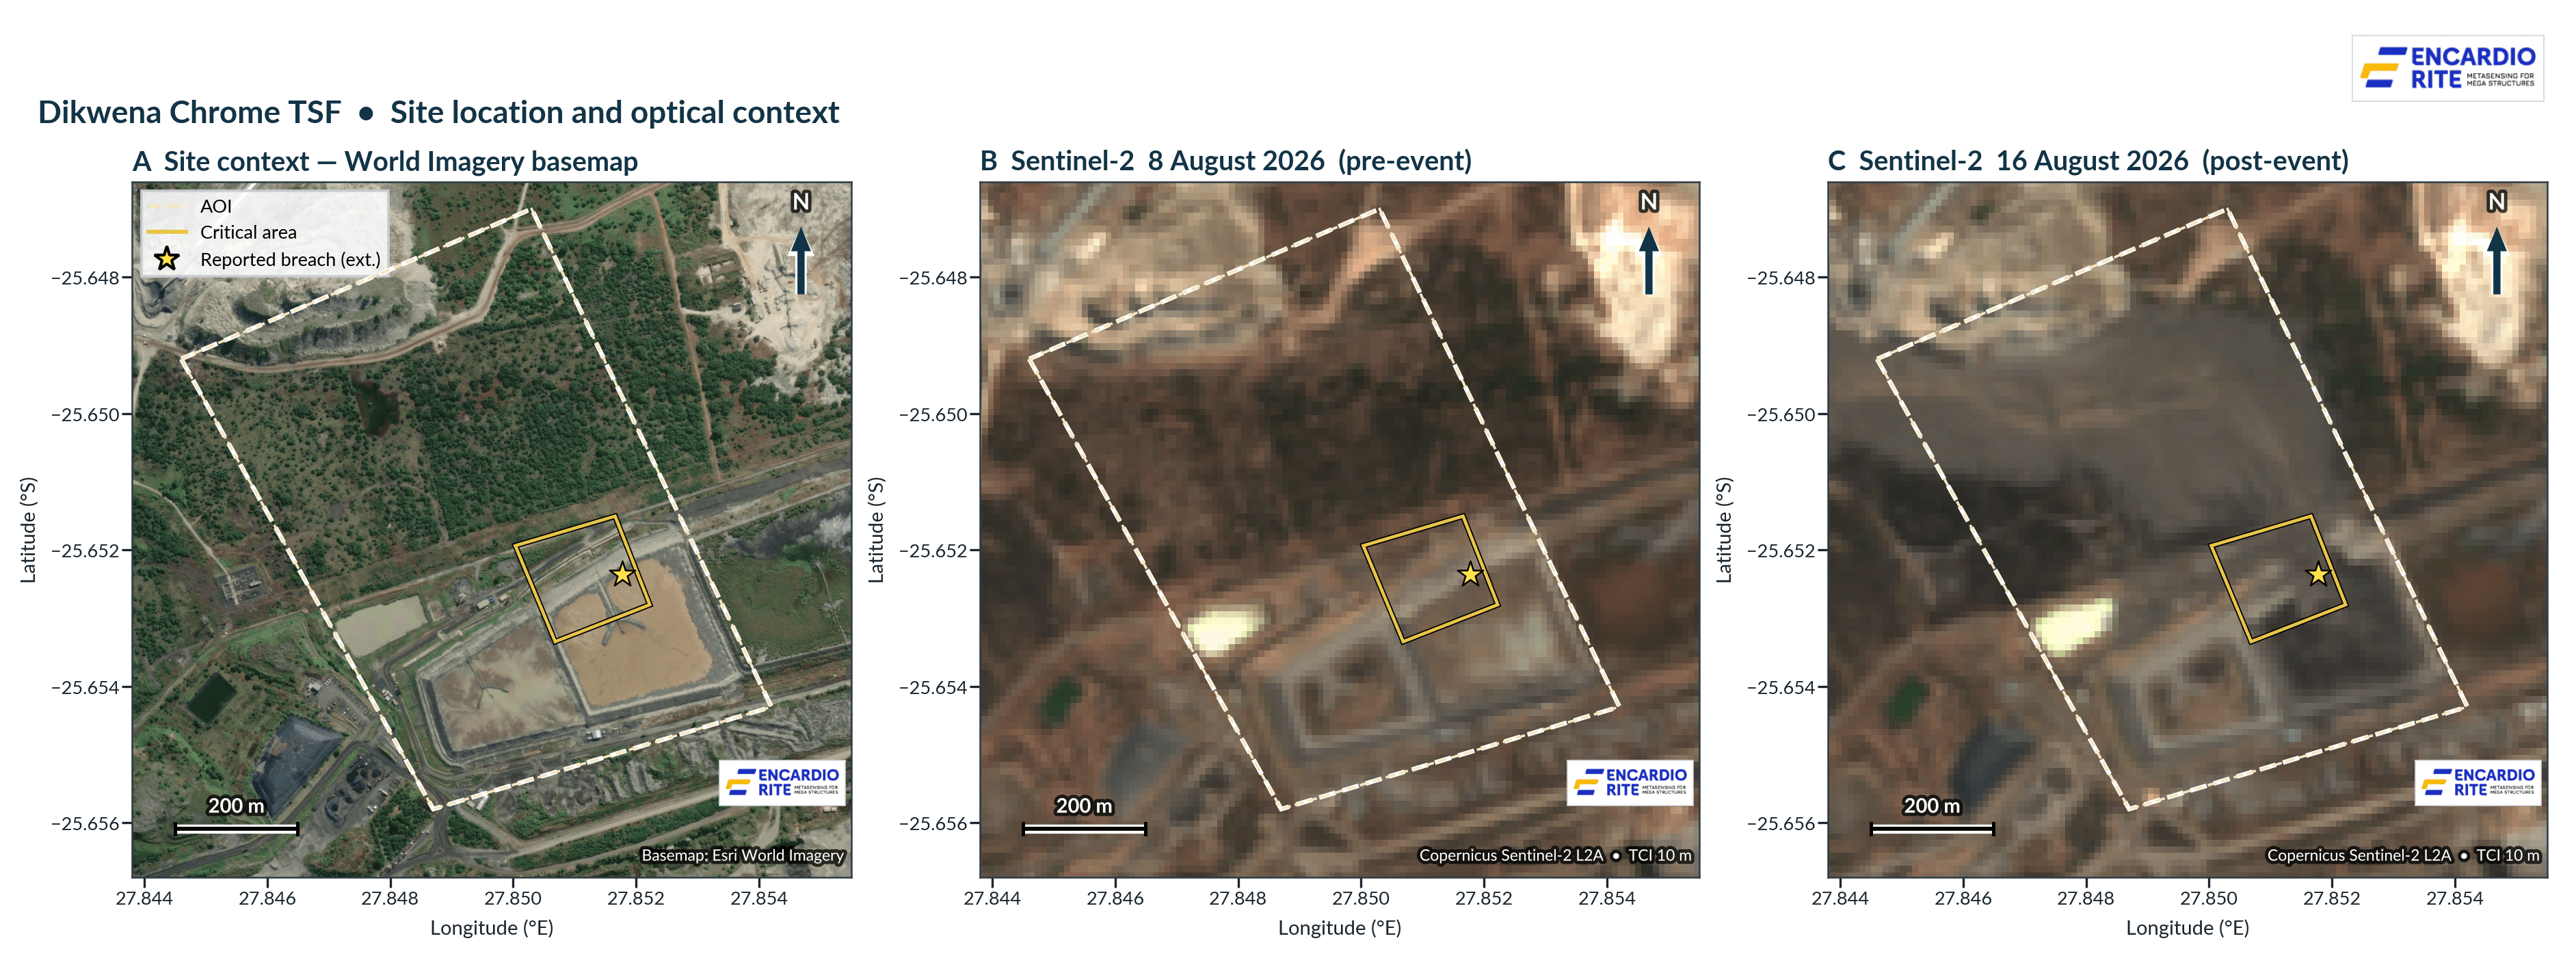
Image: This is Samancor Dikwena Chrome, a tailings facility in South Africa. On 13 August 2026, part of it failed.
What the satellite data showed
Following the event, Encardio Rite's InSAR team conducted a retrospective deformation assessment using SBAS satellite data covering January 2023 to August 2026 - 105 epochs and 2,455 measurement points across the facility and surrounding area. The median displacement was used as a robust measure of the central behaviour of the Critical Area, reducing the influence of individual outlier or noisy InSAR measurement points and providing a representative area-level indicator of deformation behaviour.
This is a retrospective analysis: the Critical Area was assessed with knowledge of the reported failure location. The purpose of this analysis is therefore not to claim that the failure was predicted, but to evaluate whether measurable deformation behaviour was present in the historical satellite record before the event.
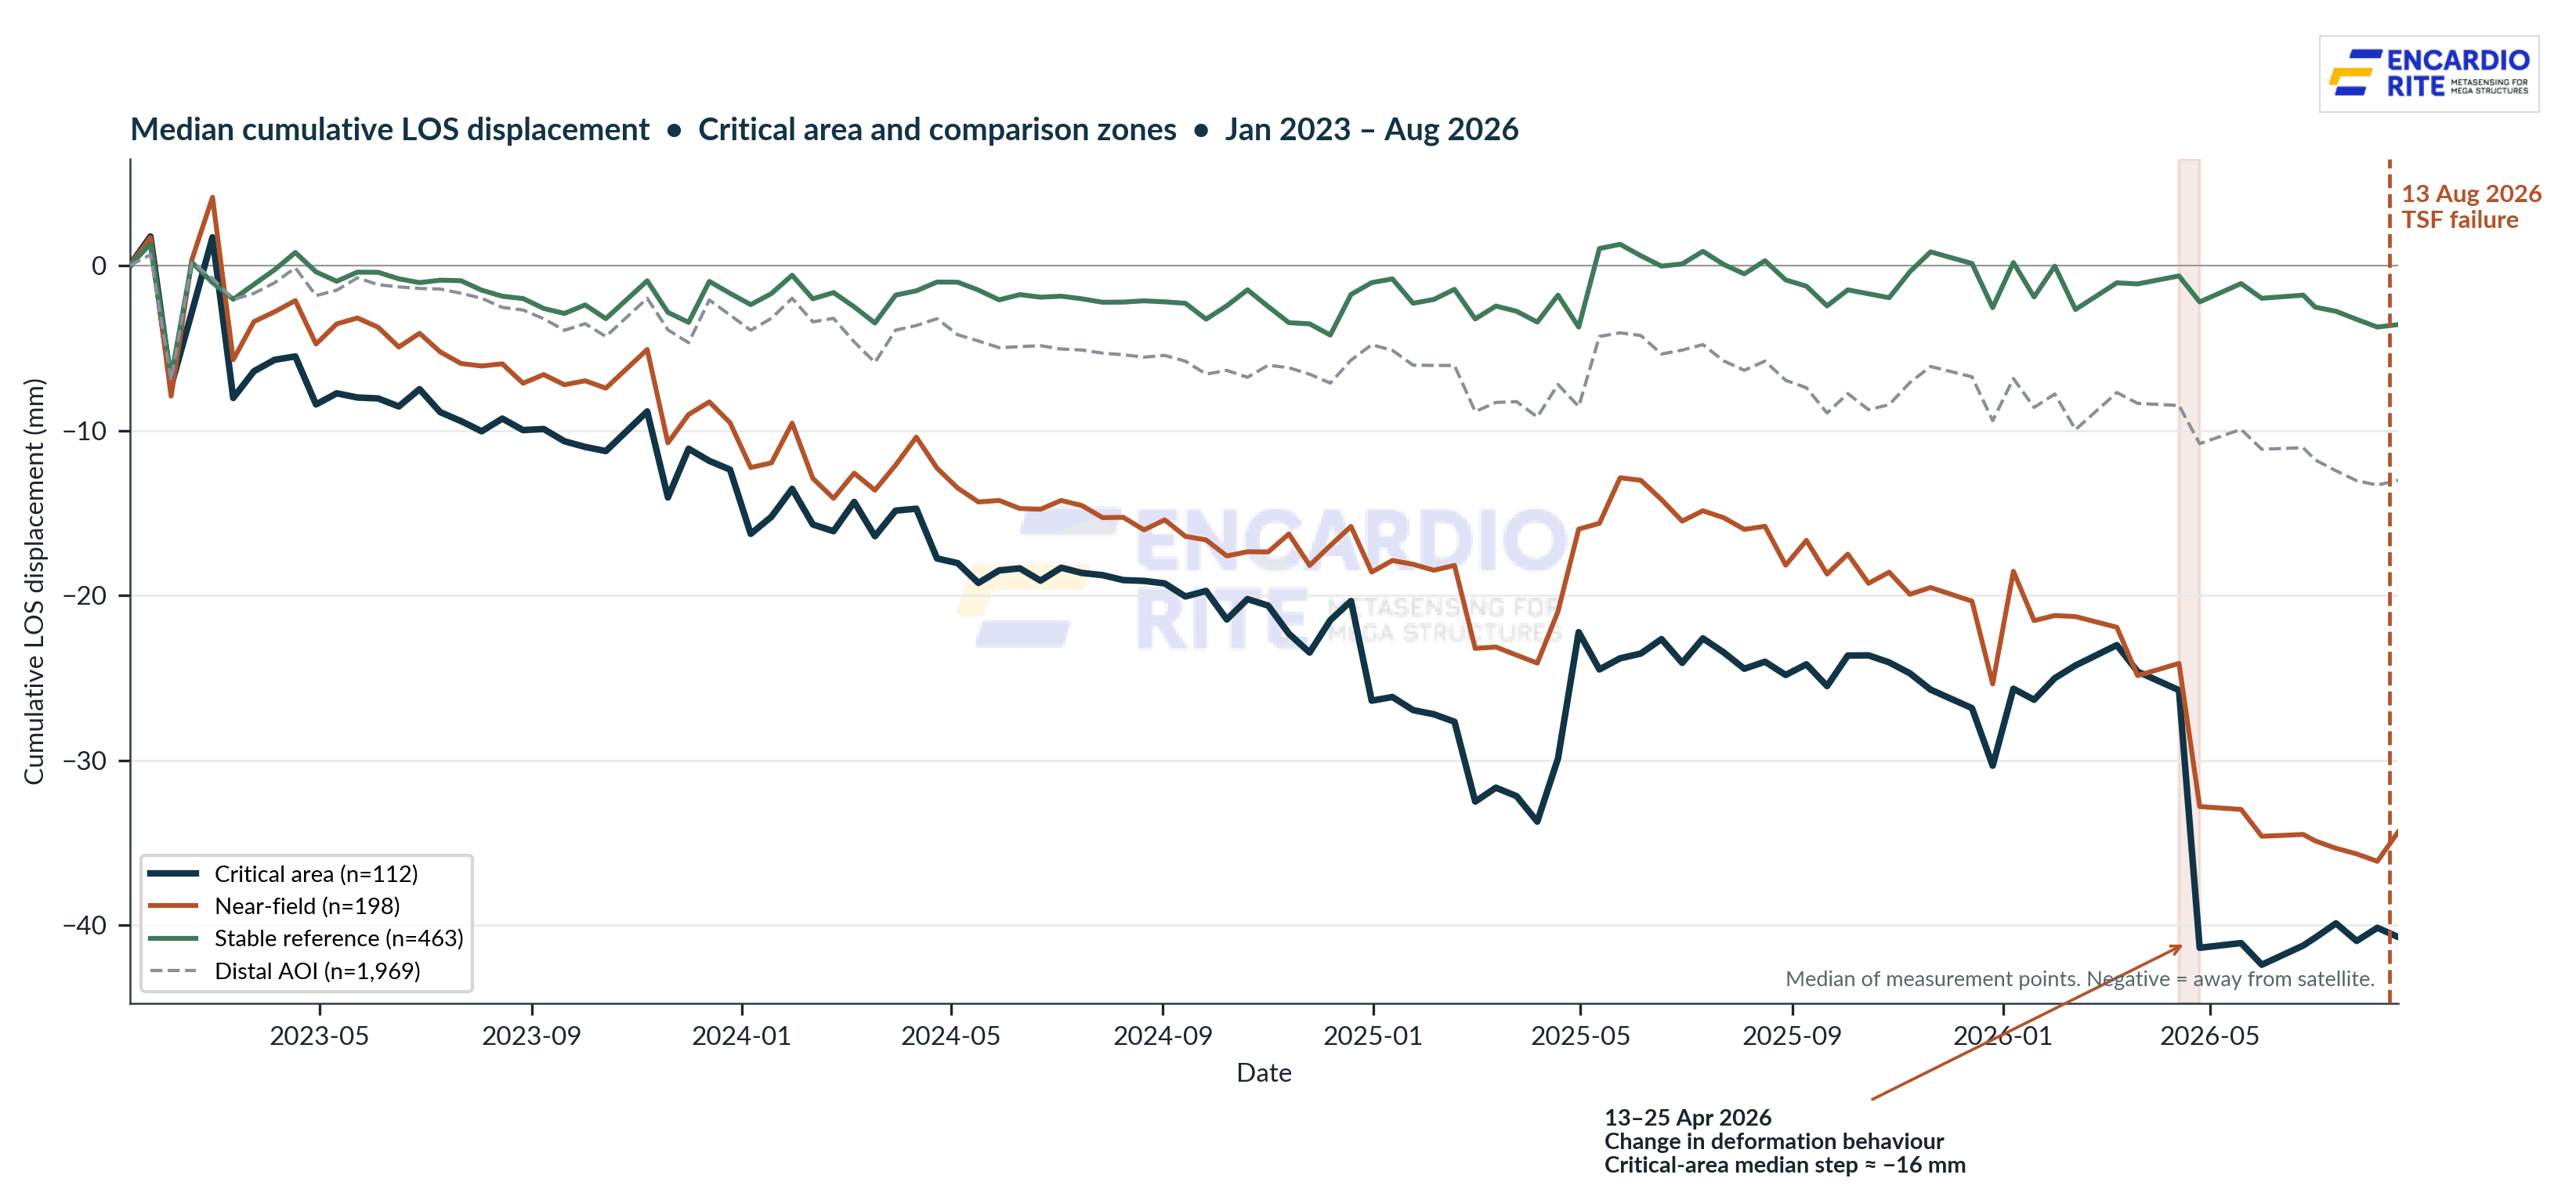
Image: This chart shows over three years of that radar data. The line trending steadily downward? That's the facility slowly sinking, while a stable reference area nearby barely moves at all.
Persistent long-term deformation
From January 2023 through the last pre-event acquisition on 6 August 2026, SBAS record showed persistent line-of-sight deformation within the Critical Area corresponding spatially with the externally reported failure location. The long-term fitted deformation rate across the Critical Area over the full January 2023–August 2026 record was approximately -8.9 mm/year, while the stable reference zone remained close to 0 mm/year. Because this fitted rate includes the April 2026 behaviour change described below, it should not be interpreted as a constant deformation velocity throughout the entire period.
A distinct behaviour change in April 2026
Between 13 and 25 April 2026 approximately 3.5 months before the failure, the Critical Area median LOS displacement changed from -25.7 mm to -41.4 mm over the 12-day interval, corresponding to a -15.6 mm LOS displacement change. This change was spatially concentrated across the critical area, not limited to isolated measurement points. The near field showed a corresponding response while the stable reference did not.
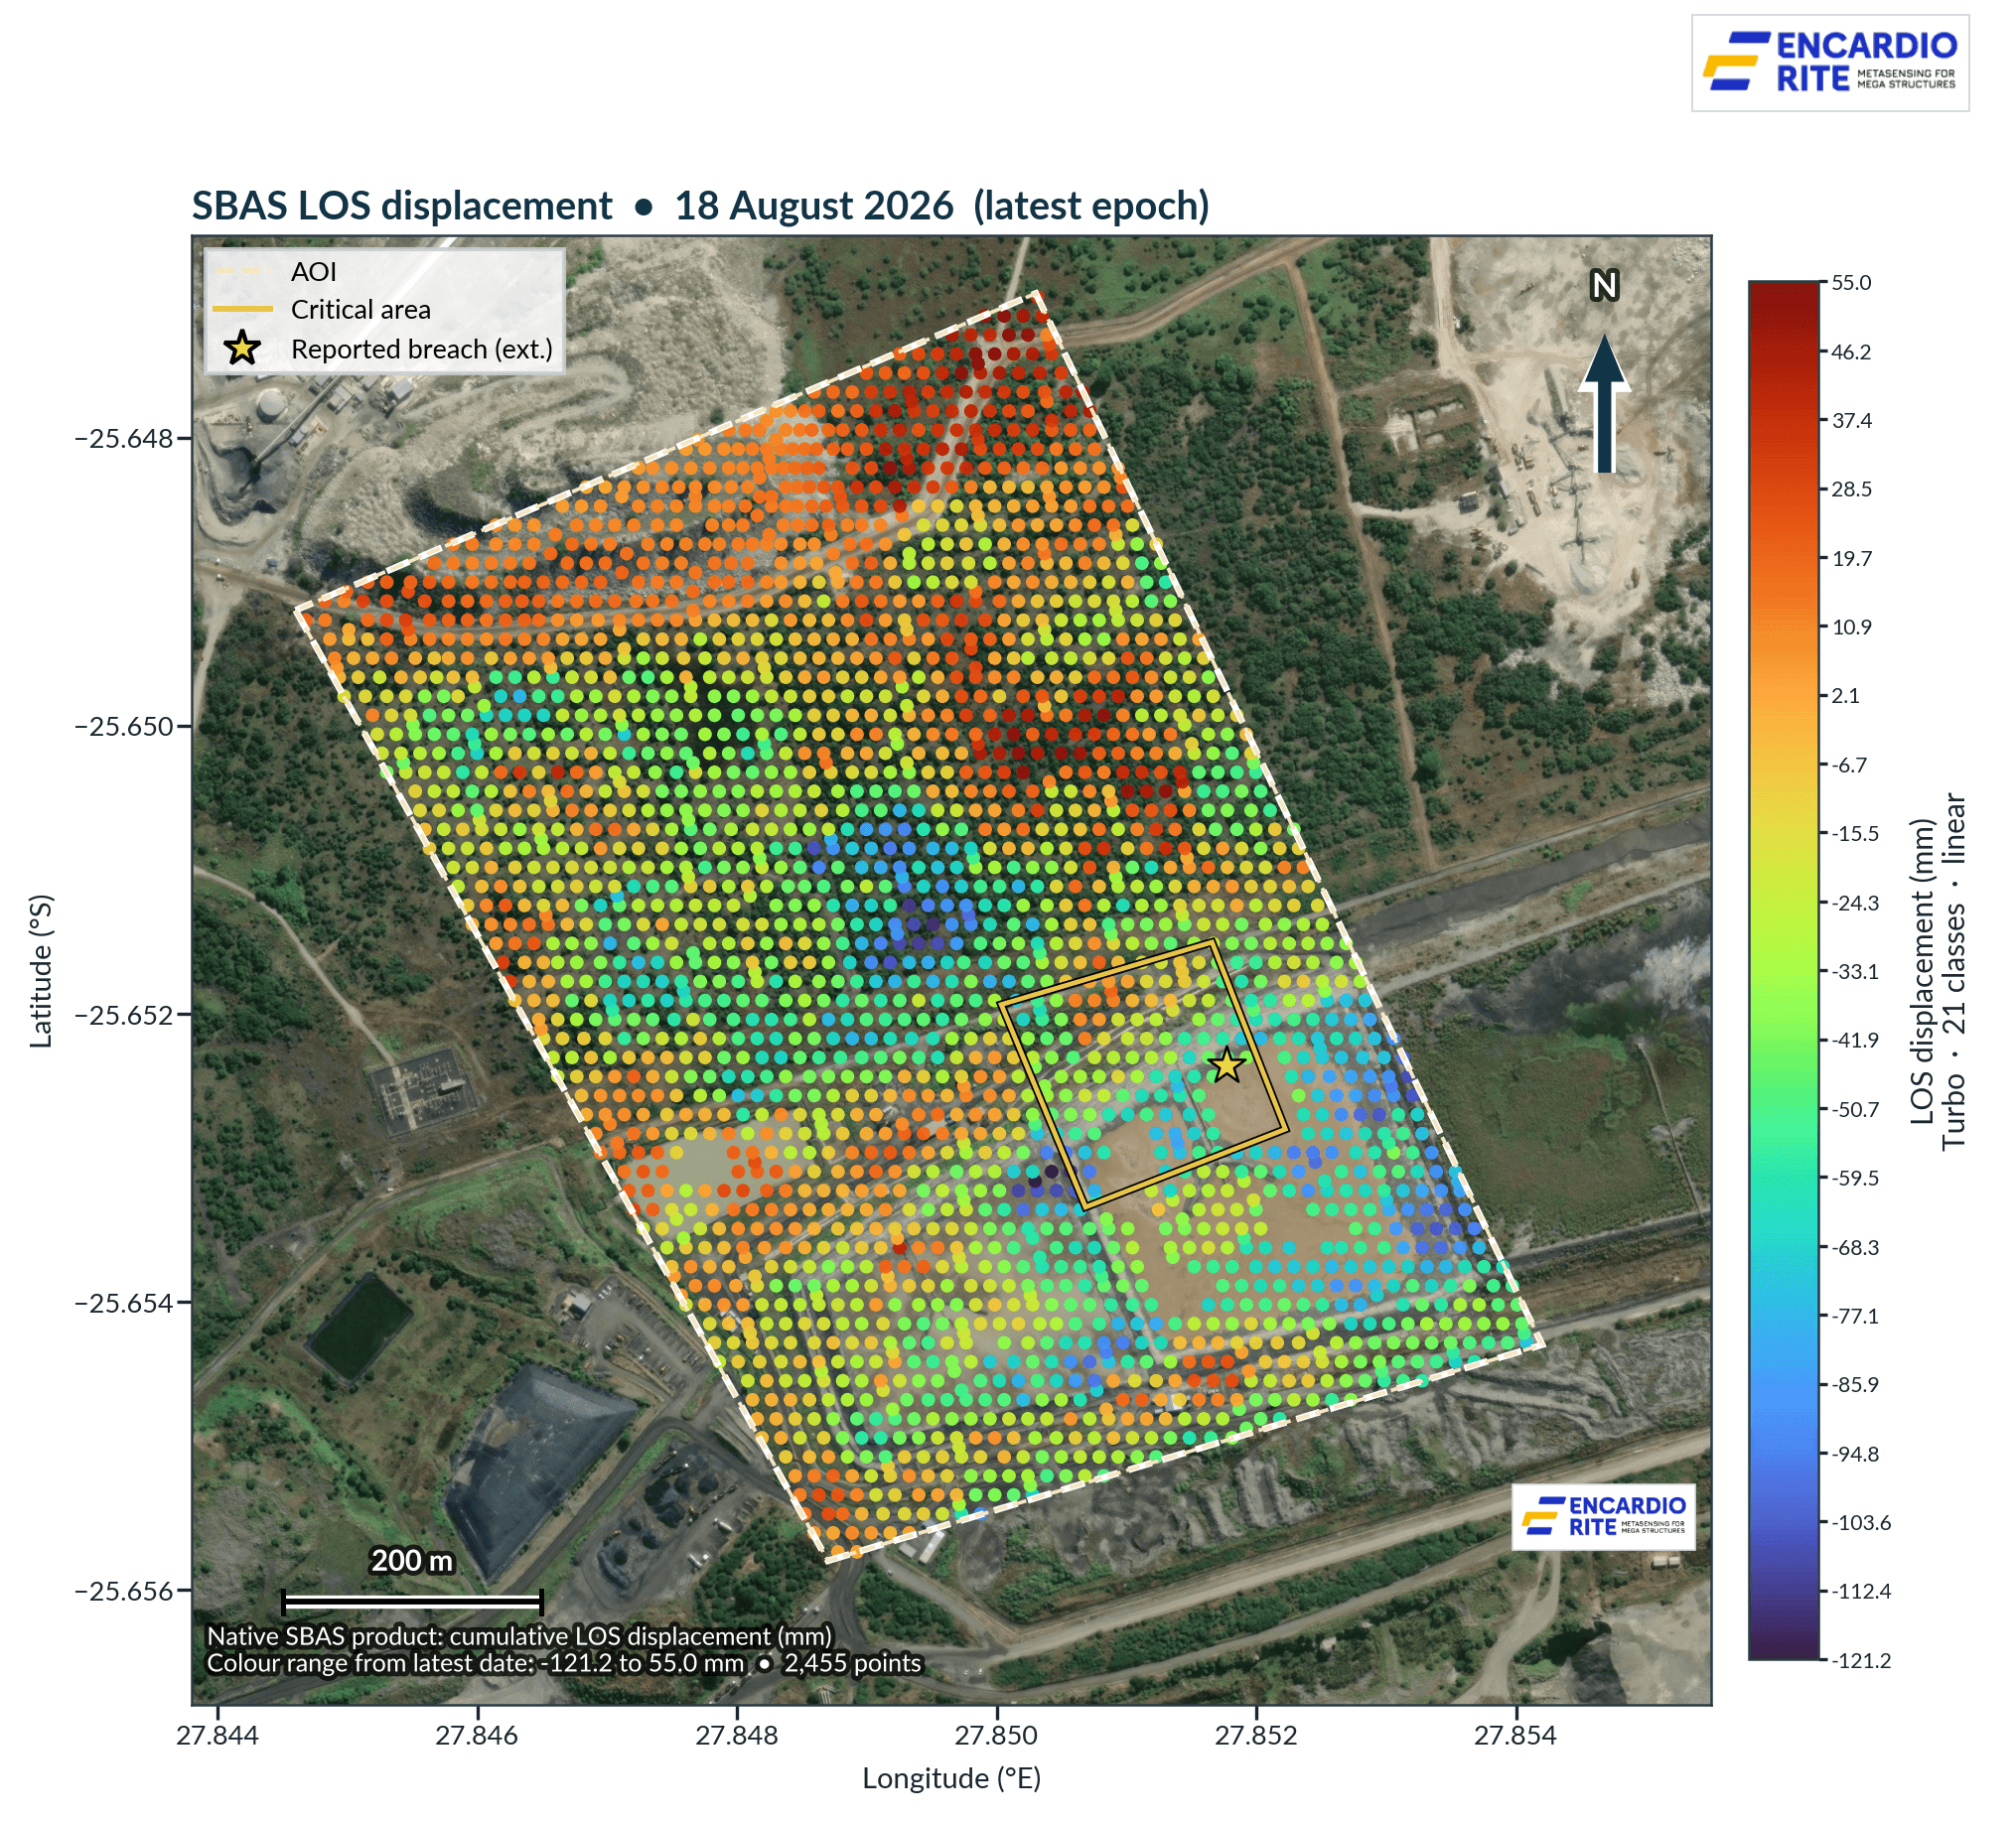
Image: Is just noise in the data? Here's the movement mapped across the entire site. The area outlined in yellow, right where the failure later happened, lights up as one of the most active zones on the whole facility.
No major surface disruption was apparent in the available Sentinel-2 optical imagery during this period, consistent with the InSAR behavior change occurring before the visible failure.
Importantly, the elevated displacement level did not recover after April. It persisted through the last pre-event satellite acquisition on 6 August 2026.
Event-scale observations across the failure window.
The reported failure occurred between the last pre-event SBAS acquisition on 6 August and the first post-event acquisition on 18 August.
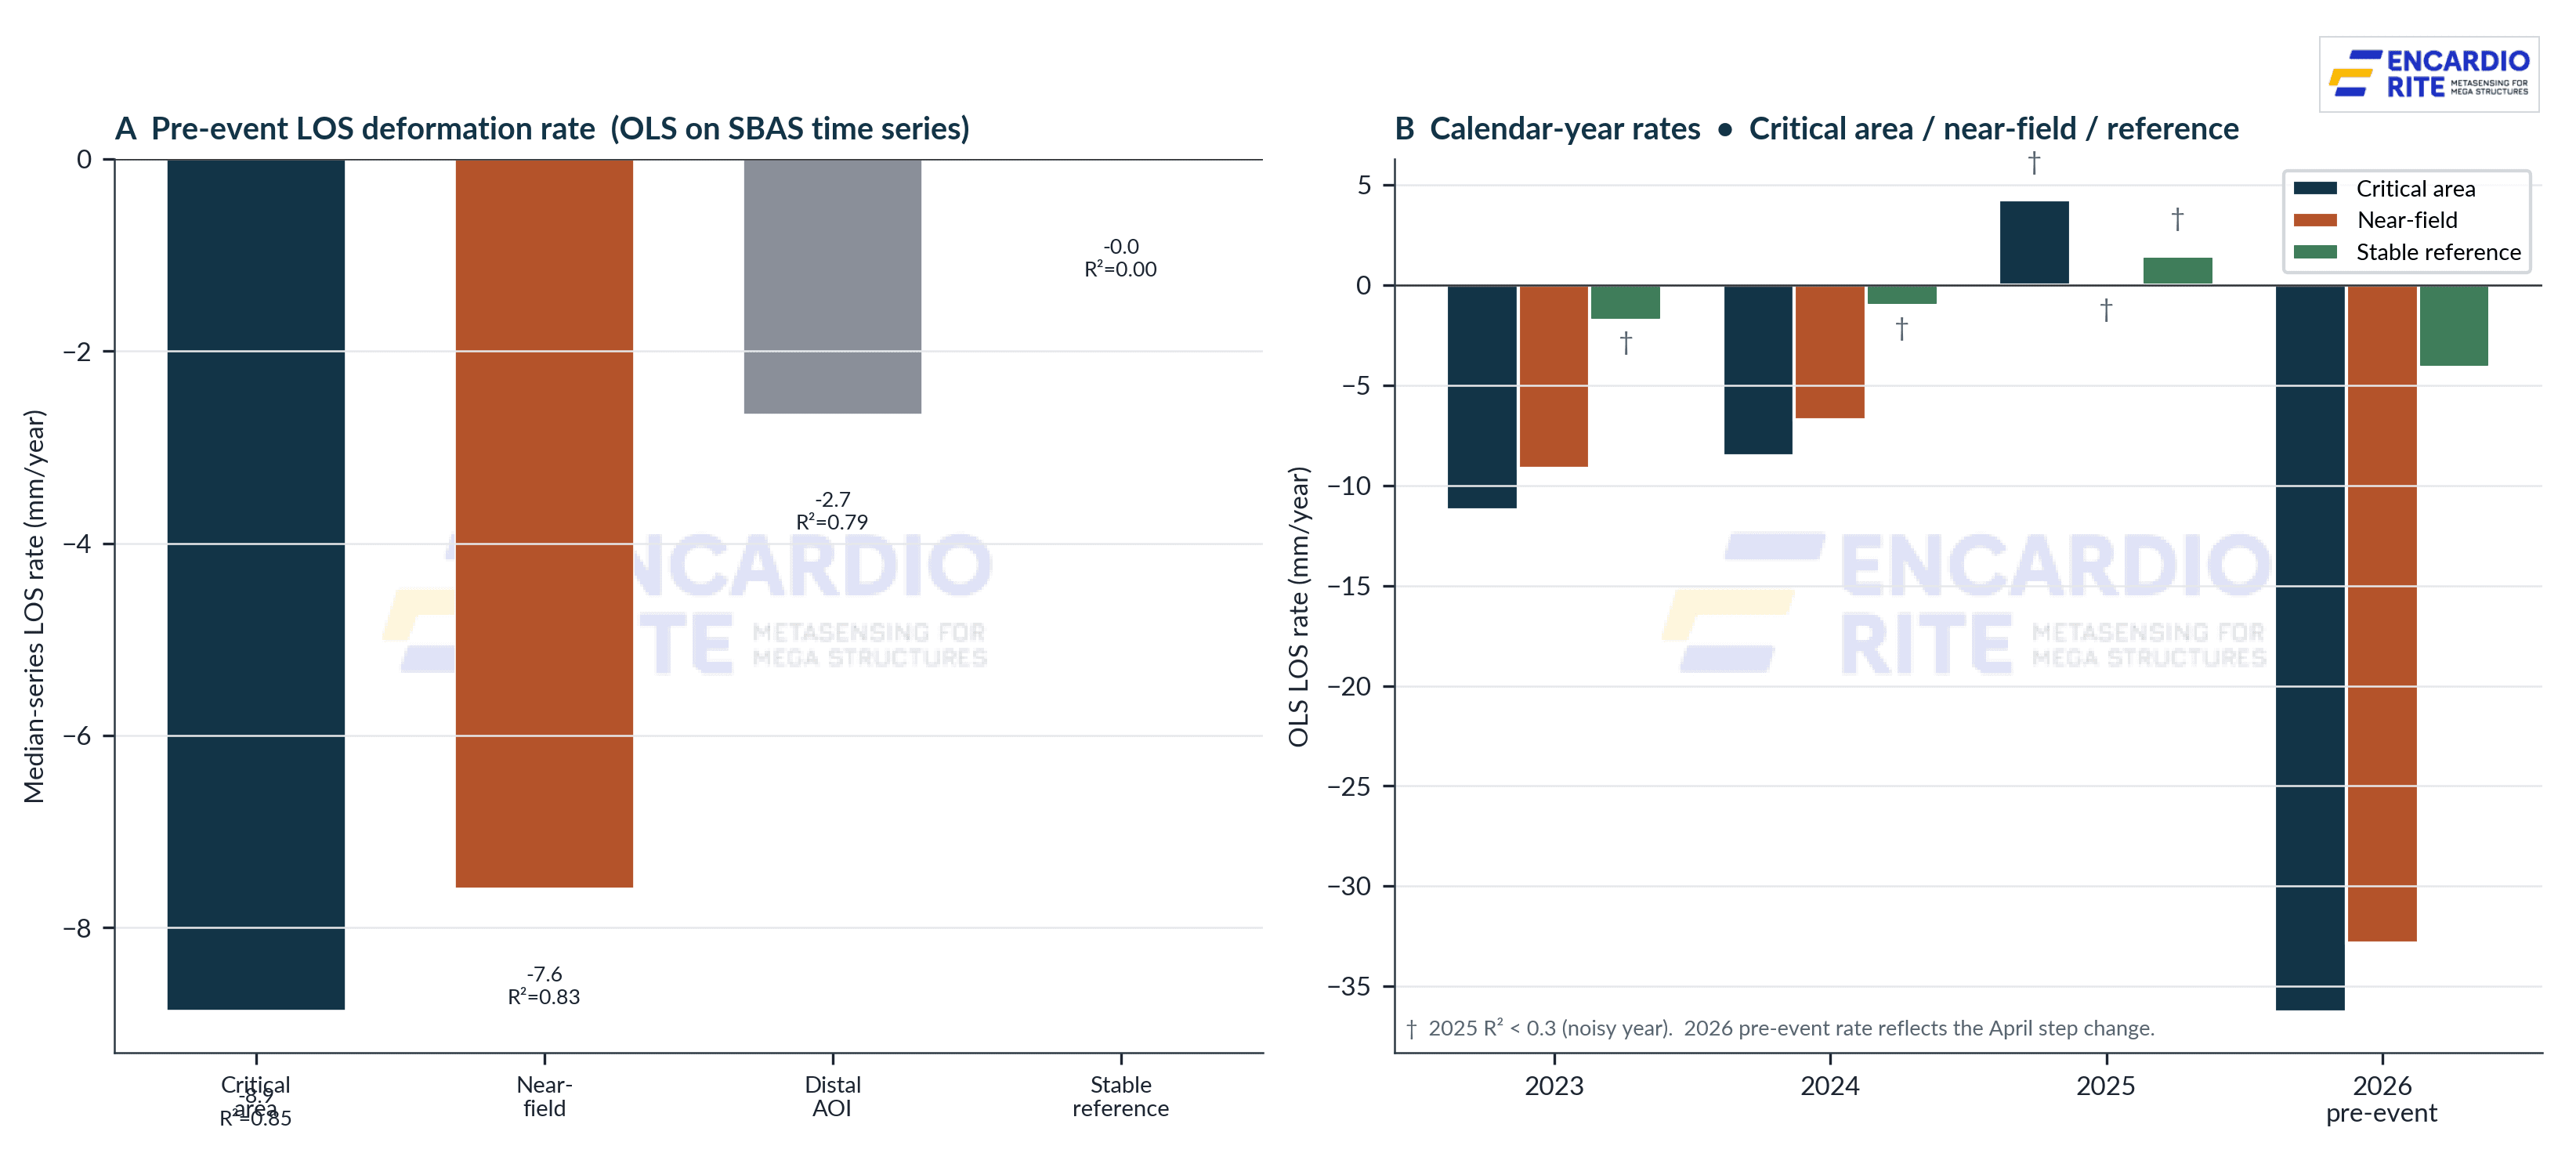
Image: The closer to the eventual failure site, the faster the ground was moving. The area that failed was sinking almost 9mm a year, while a reference zone nearby stayed essentially still. That's not a coincidence, that's a pattern.
DInSAR analysis over this window showed the critical-area median changing from approximately +1.5 mm to -6.8 mm, with 72% of valid points (n=75 of N=104) negative and 62% (n=64 of N=104) showing LOS displacement exceeding 5 mm in magnitude (the 5 mm threshold reflects the approximate noise floor of single-pair DInSAR measurements; displacement values below this level cannot be reliably distinguished from measurement noise). (A point was classified as valid if it had a coherence value greater than 0.5, was free of layover and shadow distortion, showed sufficient temporal consistency across the SBAS time series, passed phase unwrapping quality checks, and did not qualify as a statistical outlier relative to neighboring points. The threshold was set at 0.5 rather than a higher value to account for the post-event radar decorrelation (mean scene coherence 0.53 to 0.35) caused by the failure-related surface disruption itself, rather than measurement noise.) Coherence decreased from approximately 0.53 to 0.35, indicating increased radar decorrelation in the post-event scene. This is consistent with the reported failure-related surface disturbance. A subset of 33 SBAS points (of 112 total points assessed) showed a LOS decrease of at least 5 mm, with a median decrease of approximately −7.5 mm between the two acquisitions. The strongest individual drop was approximately -11.5 mm, localised to the area of the reported breach. Acquisition geometry: ascending pass, right-looking, Sentinel-1 IW3 (VV polarisation), relative orbit 116 (12-day repeat), acquisitions at approximately 16:46 UTC. The long-term SBAS series is derived mainly from Sentinel-1A; the 6 and 18 August 2026 failure-window pair used for the event-scale DInSAR analysis is from Sentinel-1D (absolute orbits 4007 and 4182).
Resolved (confirmed by the analyst): the +1.5 mm and -6.8 mm values represent genuinely comparable, co-located point-tracked epoch states (not a single interferometric pair). The Critical-area median DInSAR LOS displacement therefore changed from approximately +1.5 mm (6 August) to -6.8 mm (18 August), a net change of approximately -8.3 mm across the failure window, based on co-located point comparisons.
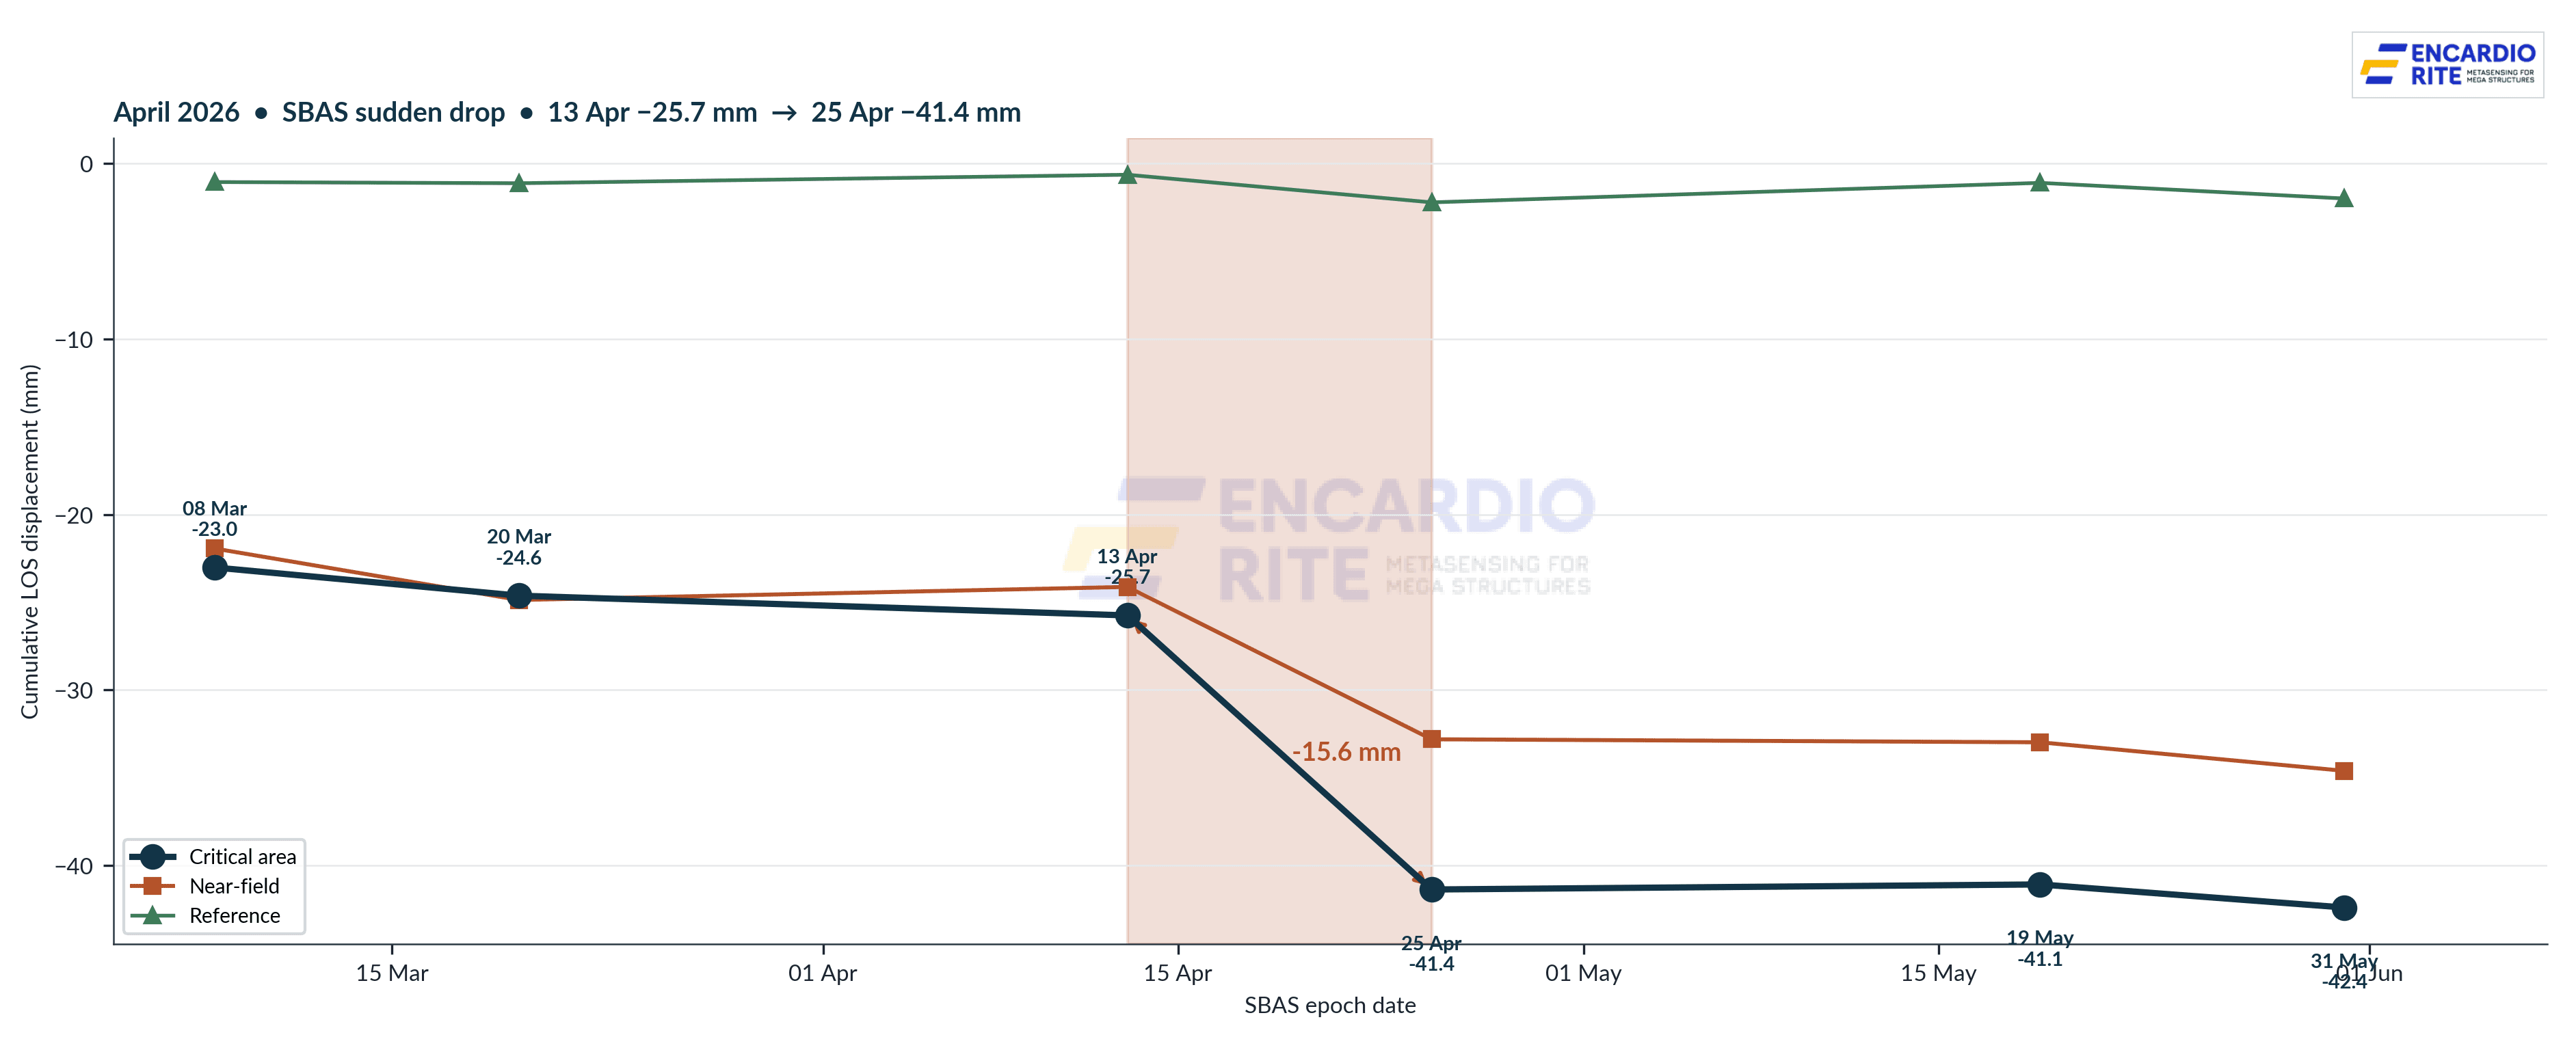
Image: In just 12 days in April 2026, the ground dropped by another 15.6mm, a sudden acceleration, not a slow drift. And it never bounced back. This is exactly the kind of red flag satellite monitoring that exists to catch.
What this means Negative and positive LOS values represent displacement along the satellite line of sight according to the processing sign convention and should not be interpreted directly as vertical settlement. For this processing, negative LOS represents movement away from the satellite and positive LOS represents movement toward the satellite (confirmed by the analyst).
This case study illustrates both the capabilities and the limitations of satellite monitoring and being precise about both matters.
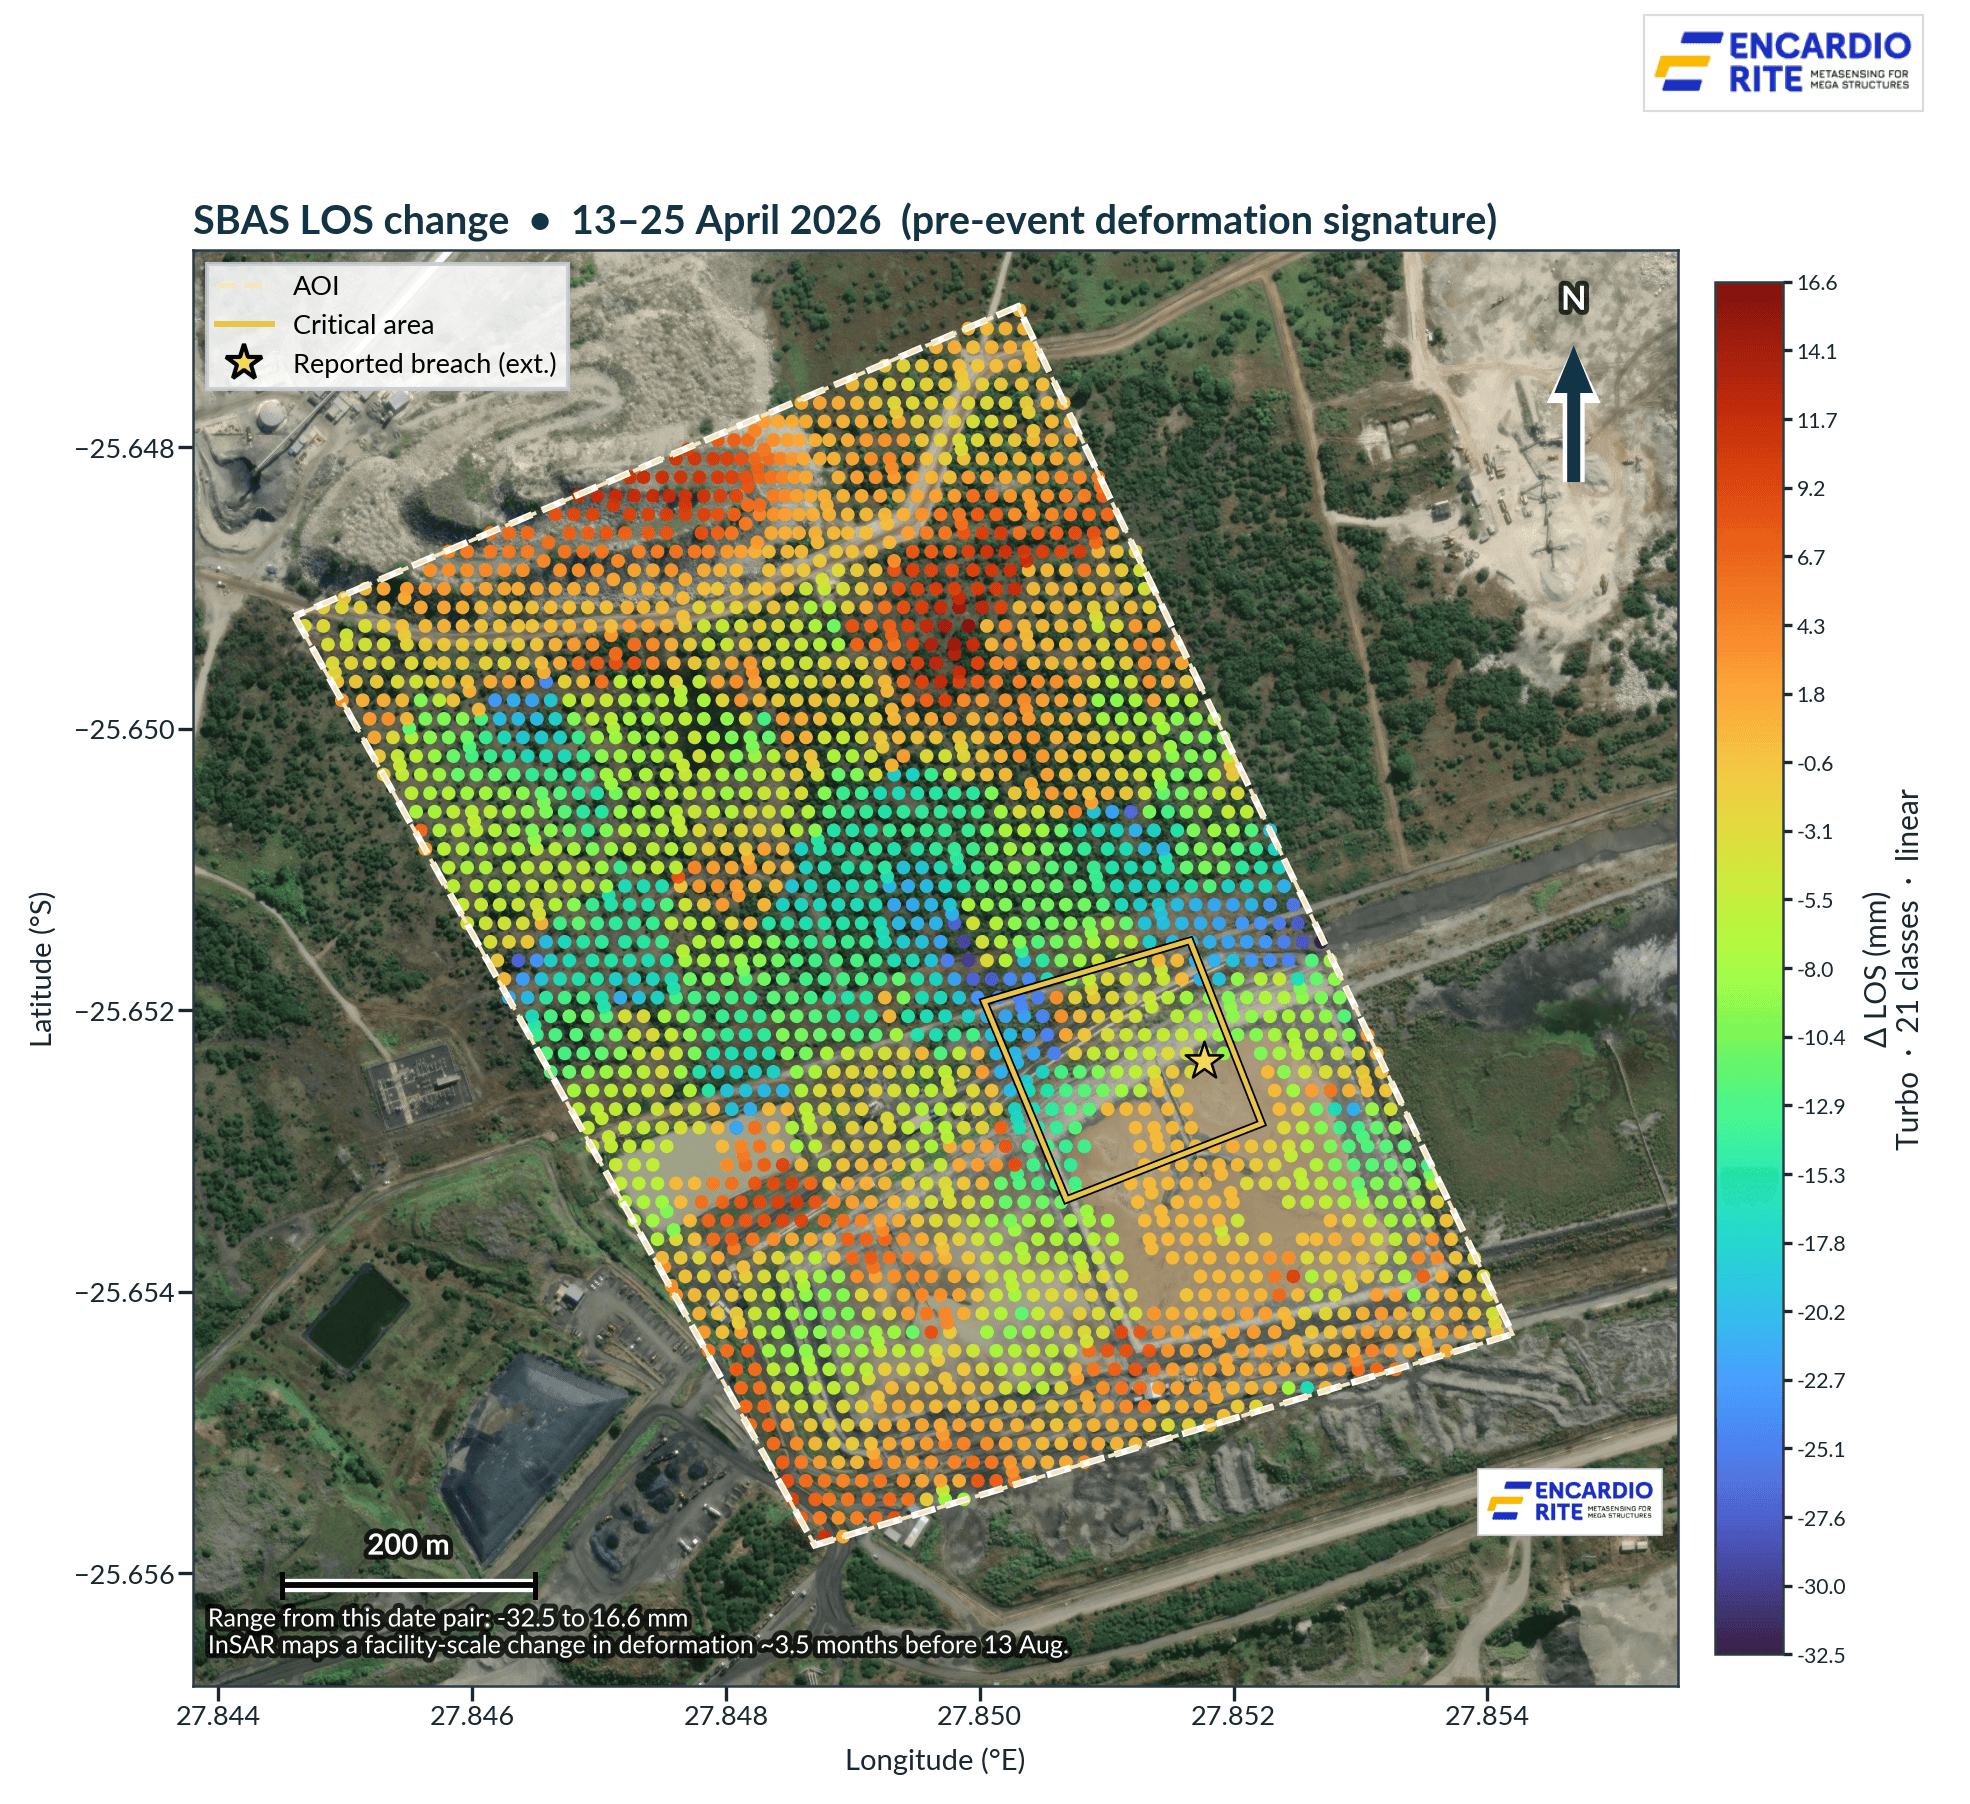
Caption: One bad pixel could be a sensor glitch. An entire facility-wide pattern can't be. This map shows the April shift wasn't isolated, it was widespread, concentrated right over the Critical Area.
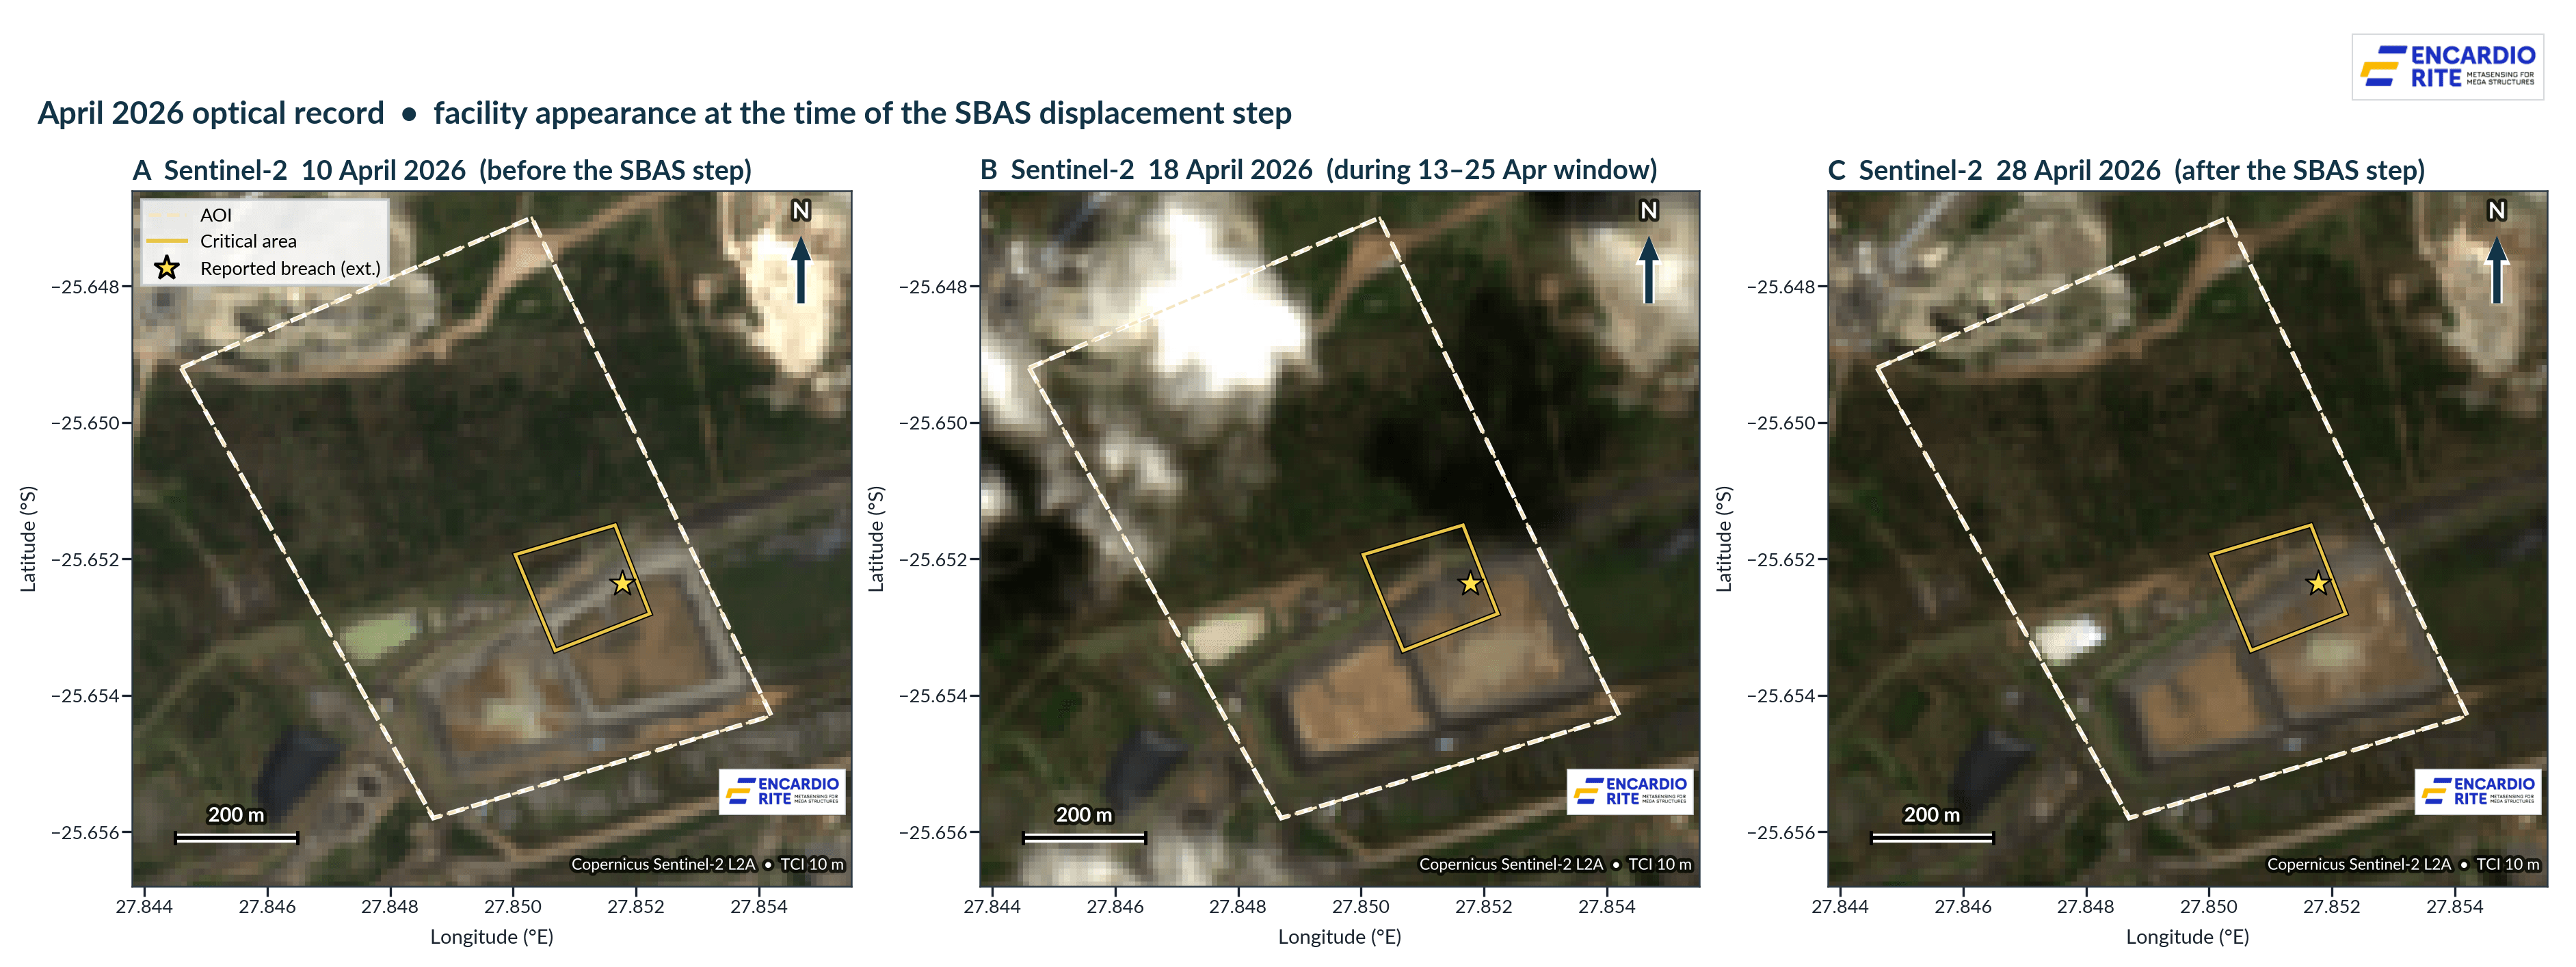
Caption: Look at these three photos from April 2026. To the naked eye and even to a regular satellite camera, nothing looks different. No cracks, no visible signs, nothing. The facility looked completely normal. The only thing that caught the warning sign was radar sensitive enough to detect a shift smaller than your fingernail is thick.
What it can do: identify areas exhibiting measurable LOS displacement, track how that behaviour changes over time, provide historical and wide-area context, and help concentrate engineering attention and additional monitoring where the evidence of change is strongest.
What it cannot do: predict failure, establish geotechnical cause, or substitute for in-situ instrumentation and engineering inspection. The April 2026 behaviour change is a retrospectively observed pre-event deformation anomaly. It does not establish that a warning was issued or that the failure was deterministically predicted. The -15.6 mm change is not a universal failure threshold; it is evidence of a distinct change in behaviour at this site during this time window.
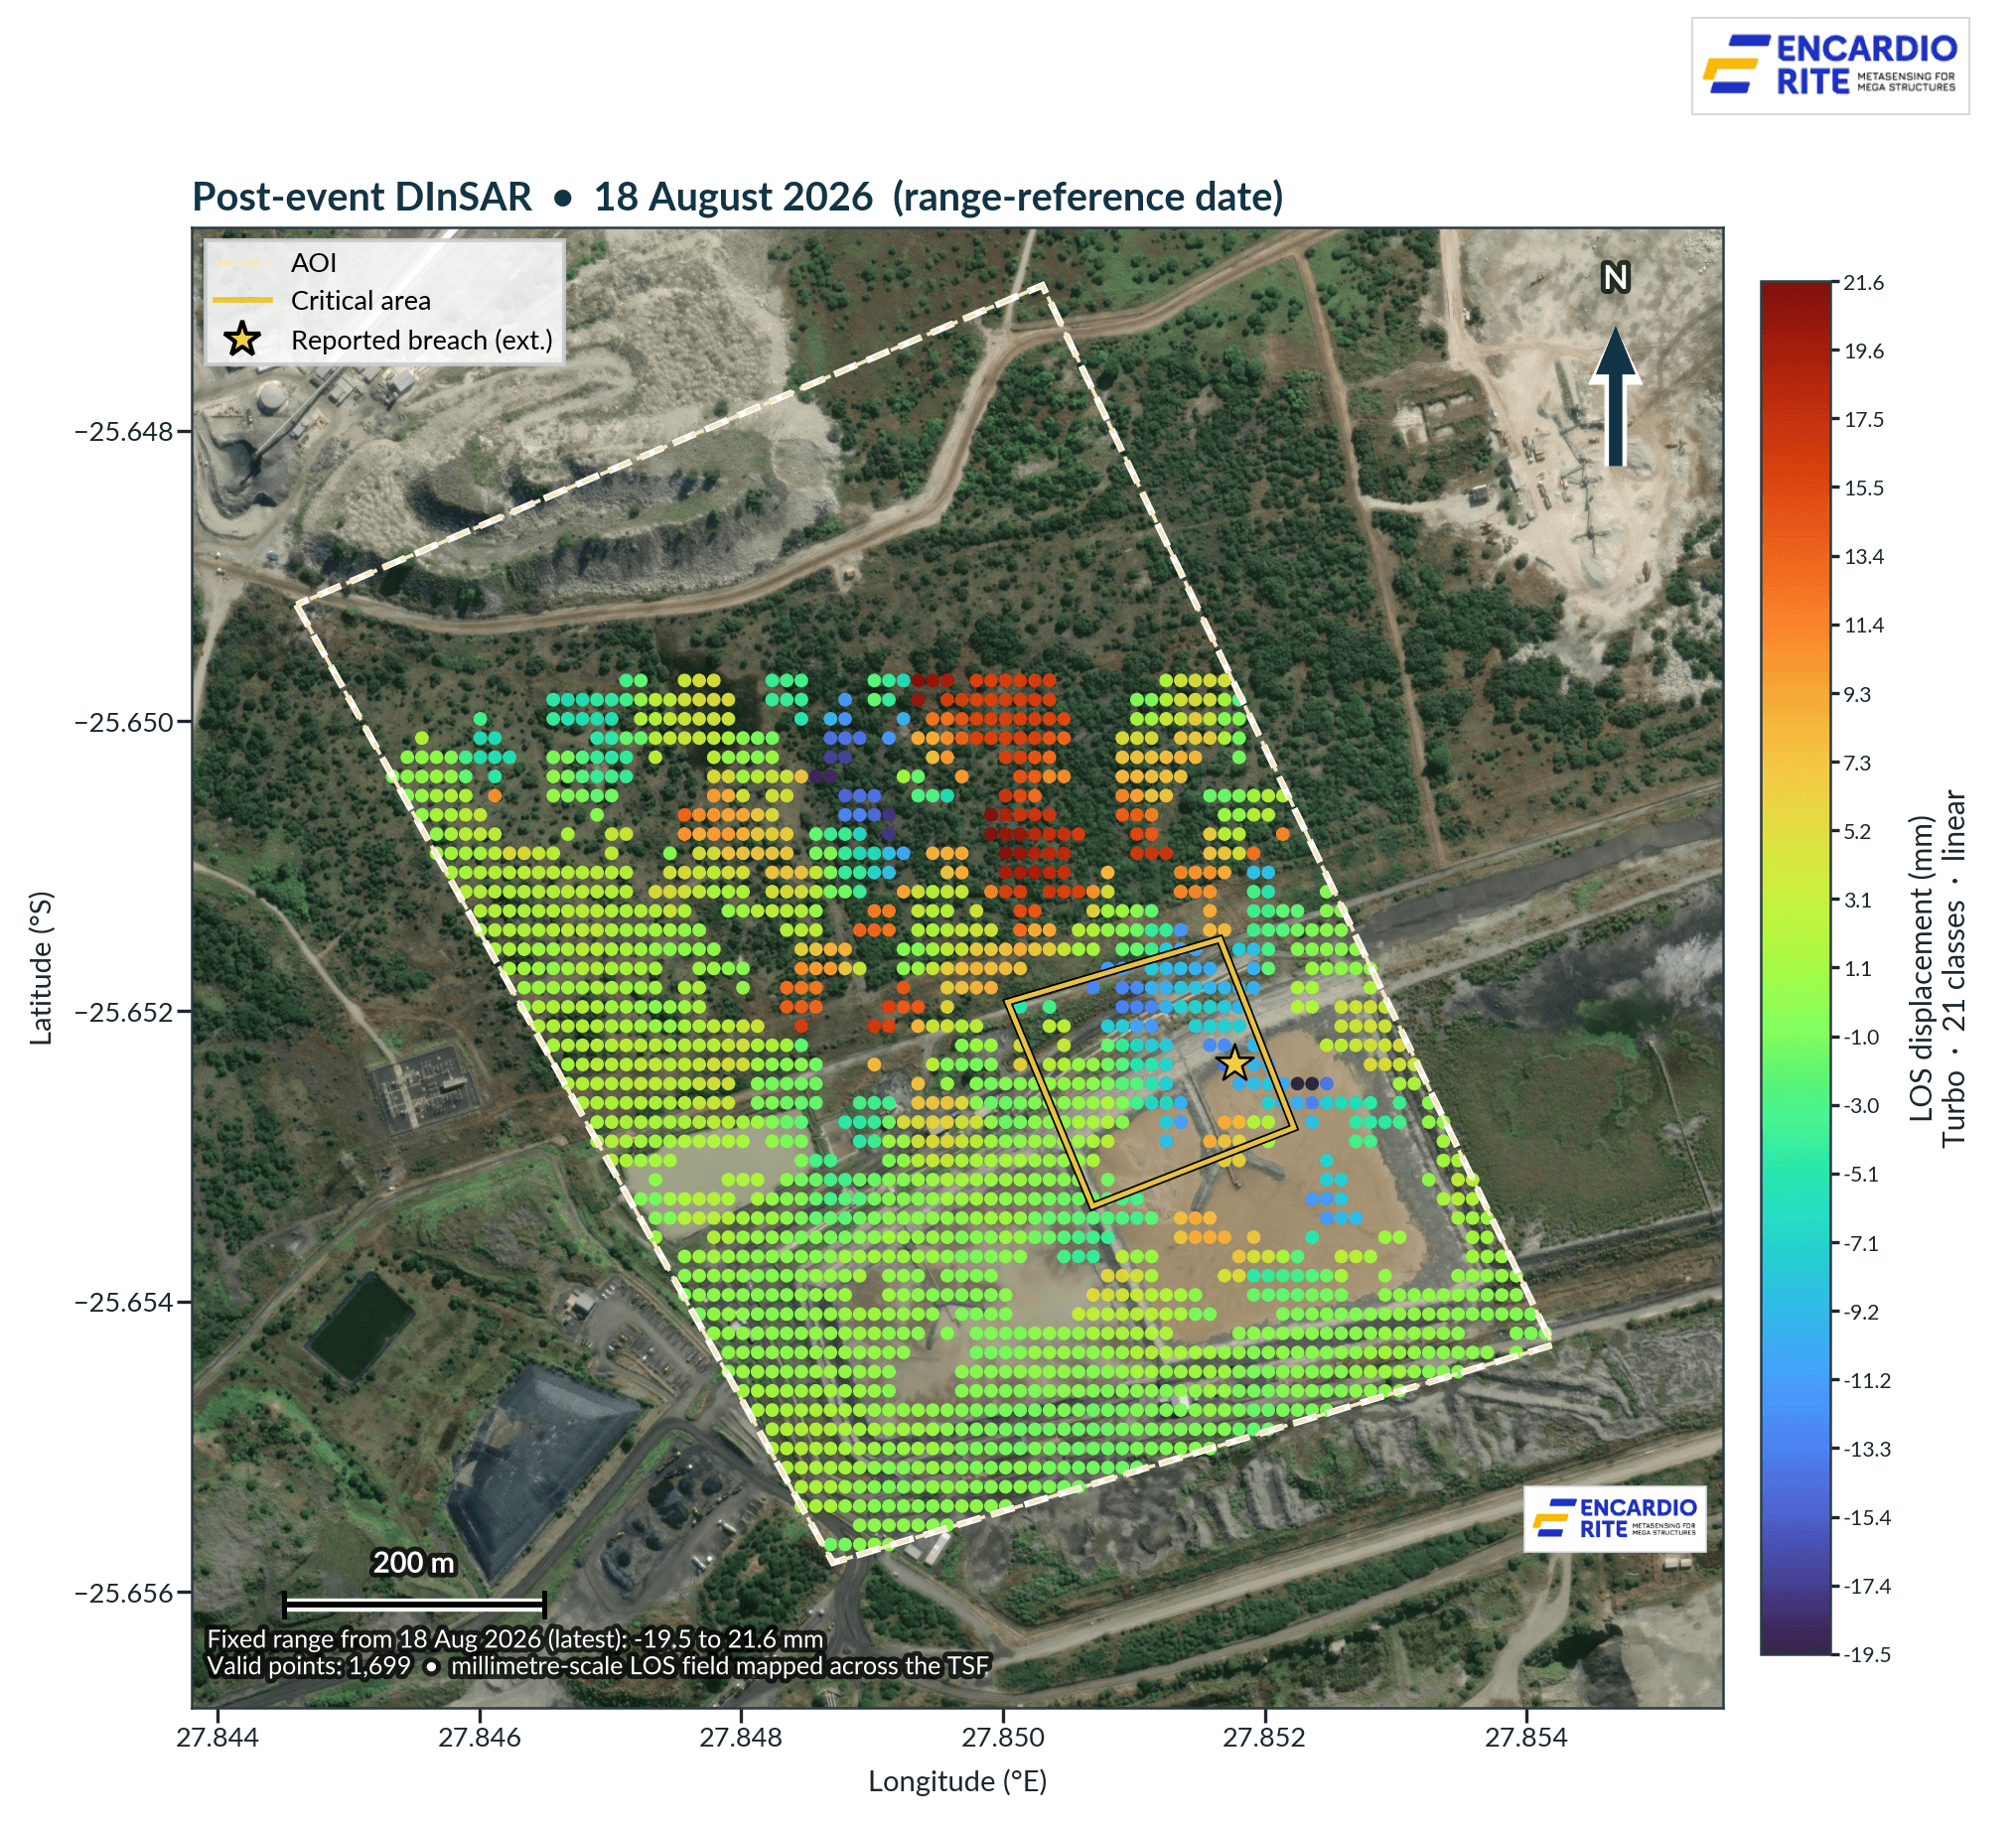
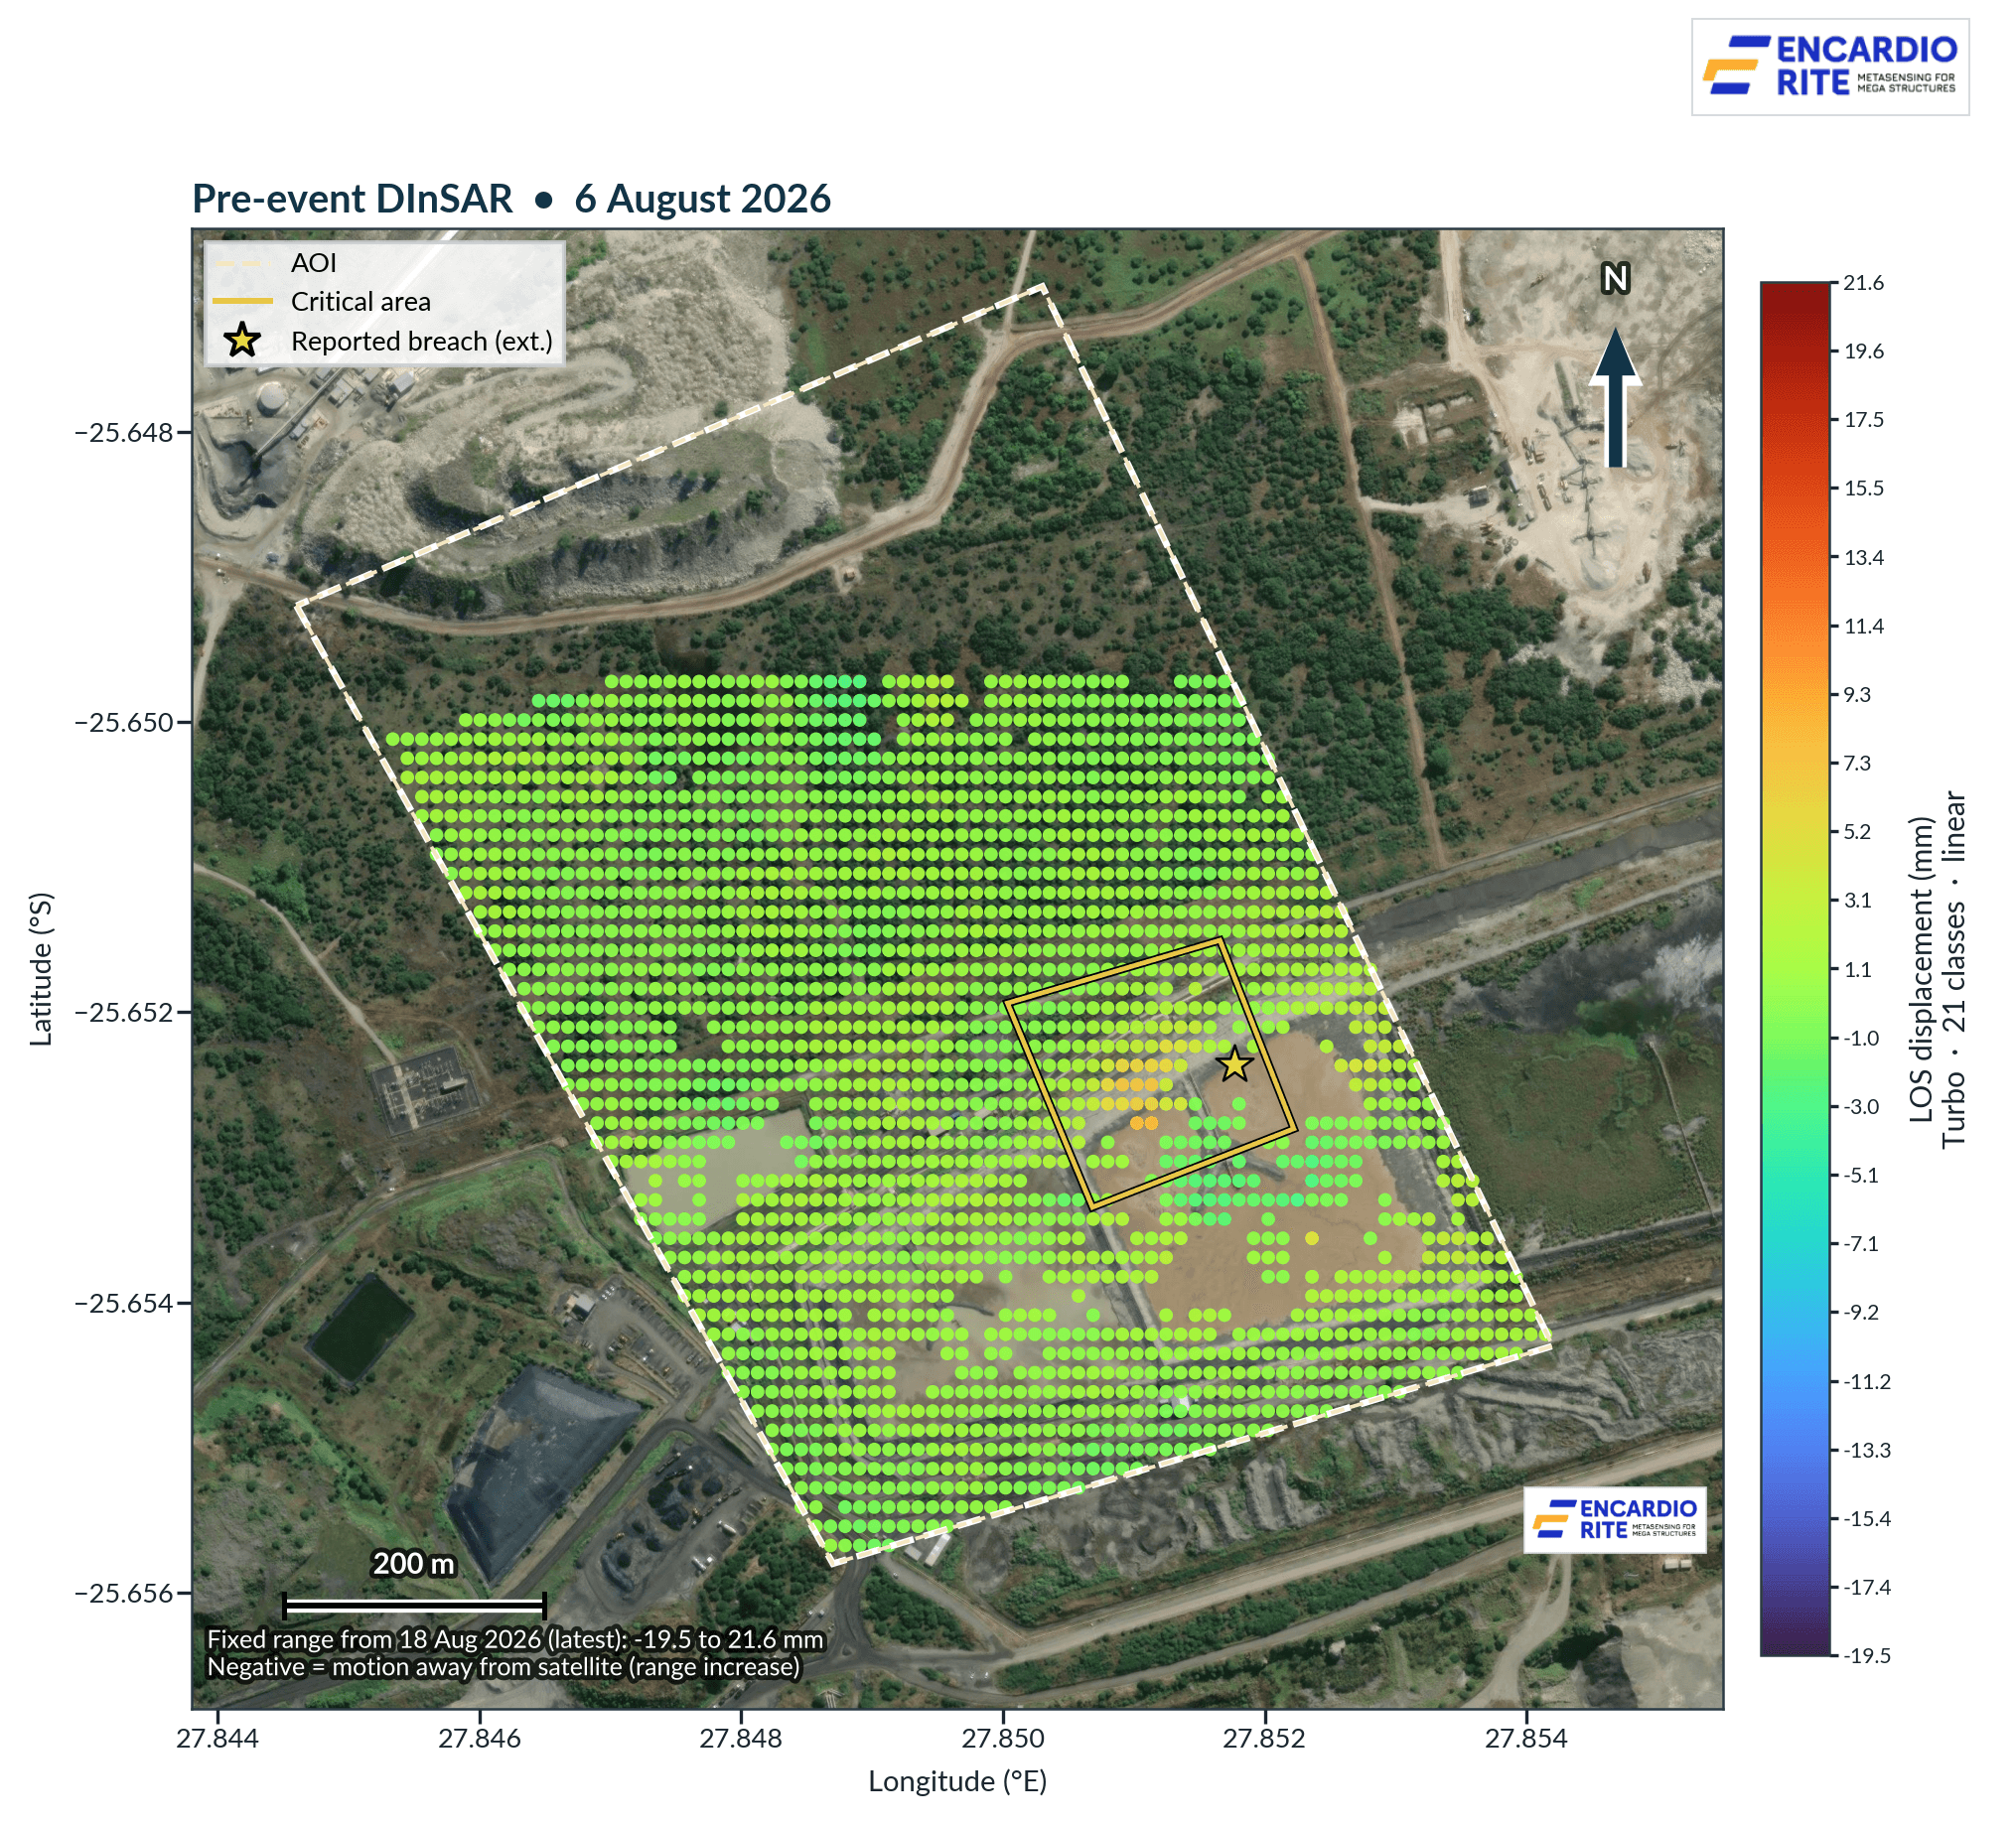
Image 1: This is the satellite radar snapshot from 6 August 2026 just one week before the wall gave way. This was the calm before the storm.
Image 2: And this is the same spot, five days after the failure. The difference is dramatic - a scattered, chaotic pattern where there used to be a clean, stable signal
The value of satellite monitoring in this context is screening and prioritisation. The SBAS record identified where persistent deformation was occurring, flagged the change in behaviour, and showed spatial concentration of movement within the Critical Area corresponding to the externally reported Compartment 1B northern-wall failure. In an operational monitoring programme, a spatially persistent change of this kind could support prioritisation of the affected area for engineering review, field inspection, and targeted instrumentation.
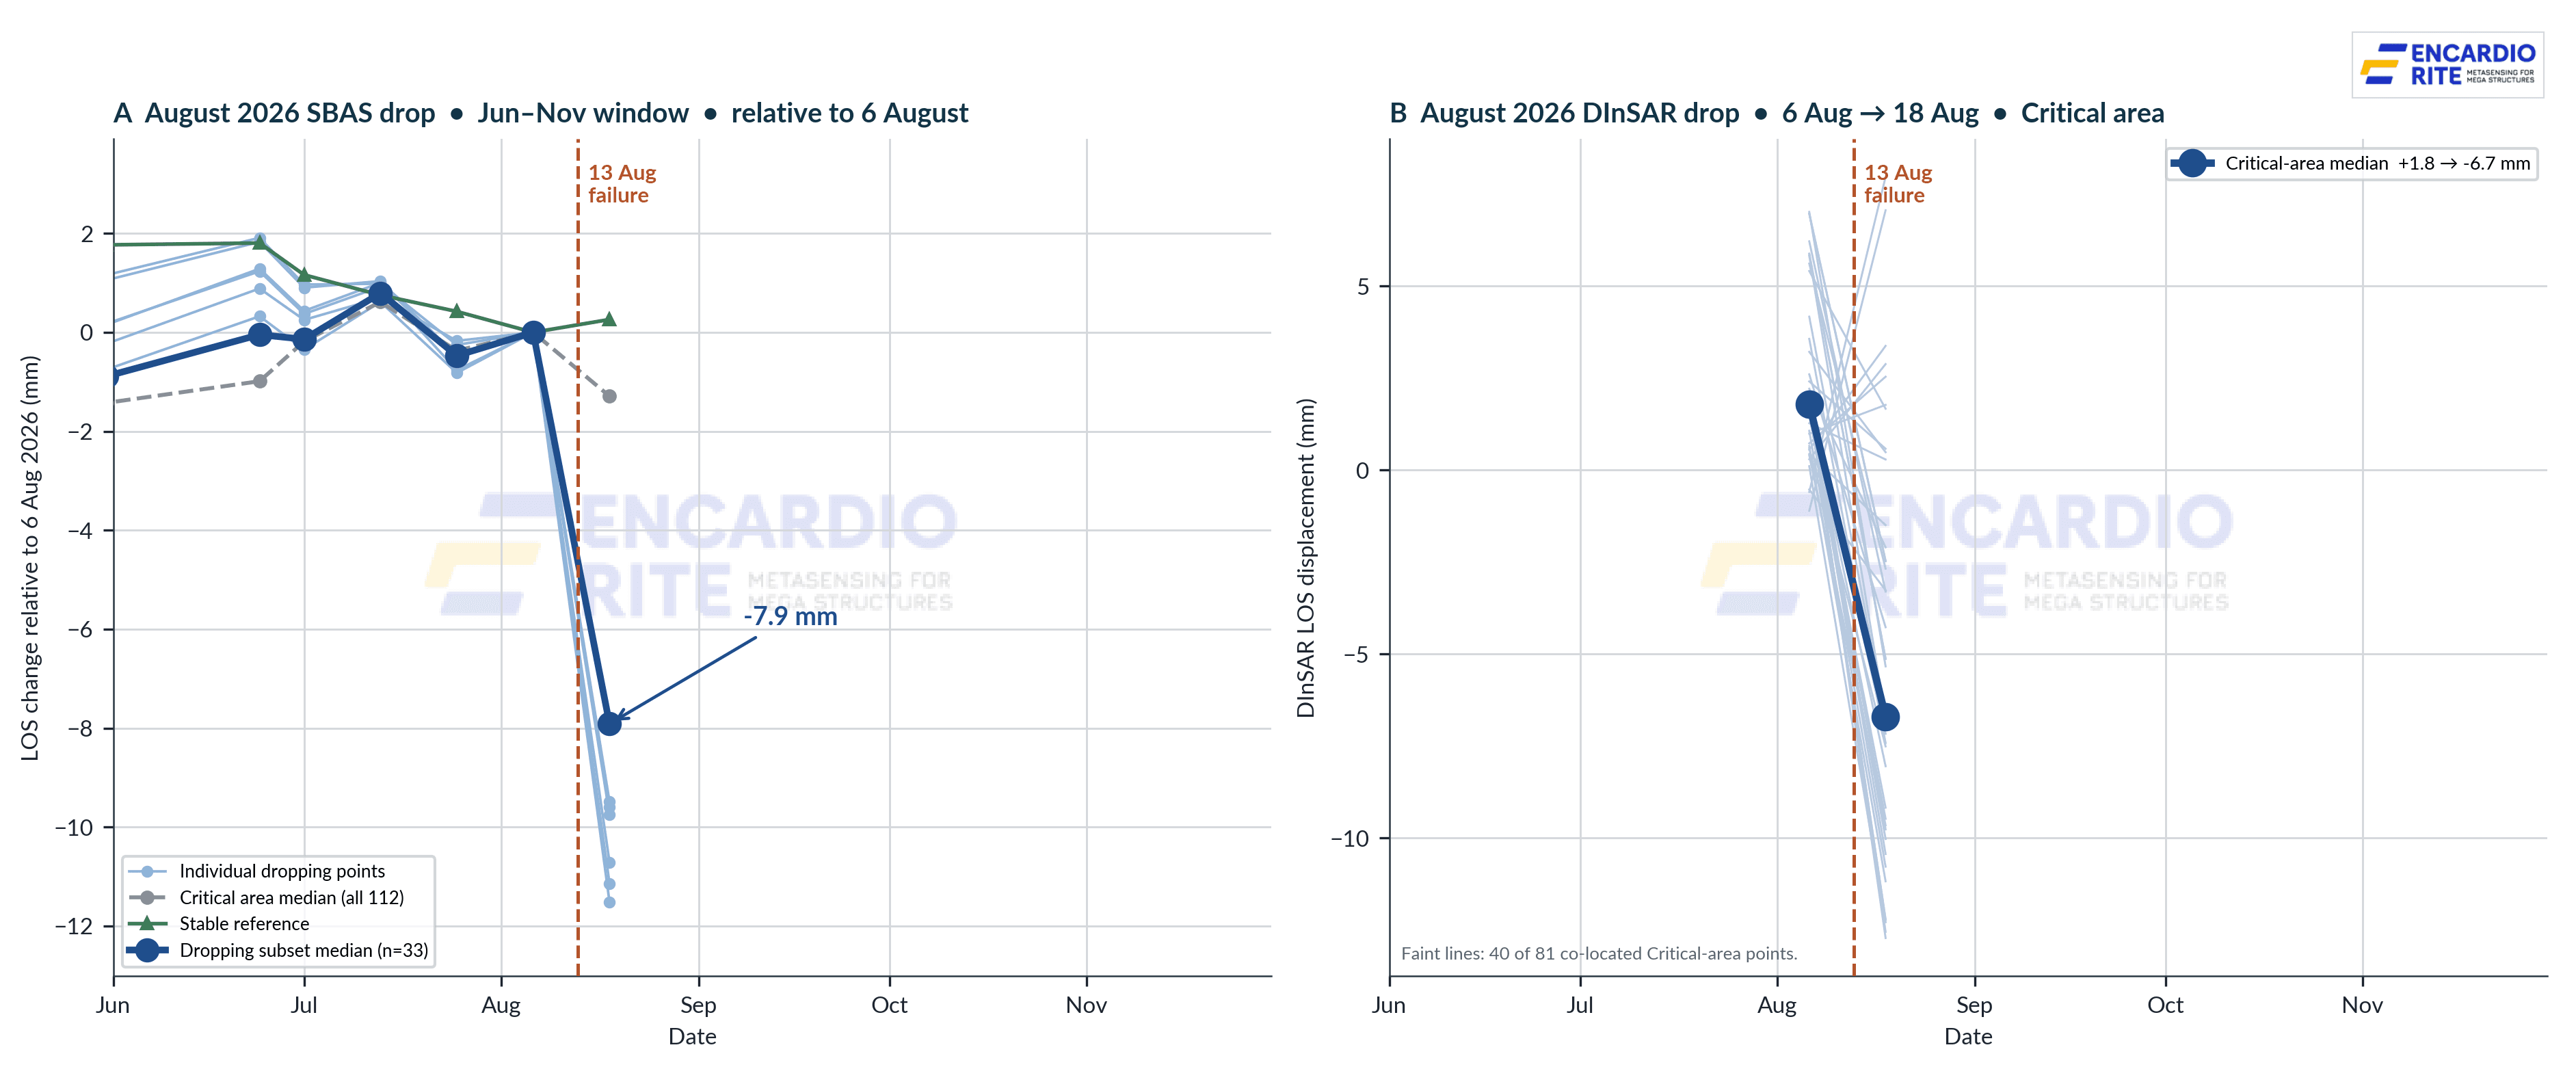
Caption: Zoom into the failure window itself: dozens of points across the Critical Area dropped sharply, some by more than a centimetre, right at the location of the reported breach. The satellite didn't just see the years of warning, it captured the event itself.
The SkyWatch connection
The workflow followed in this analysis is aligned with a satellite-monitoring approach: satellite archive access, SBAS baseline establishment, deformation trend and behavior-change assessment, spatial hotspot identification, and targeted follow-up.
In an Infinitus-integrated monitoring programme, satellite-based screening can help answer a key infrastructure-monitoring question: where should we look more closely? Rather than relying on uniform deployment of ground sensors, satellite observations can help prioritise areas where the evidence of deformation change warrants closer engineering attention and targeted ground monitoring
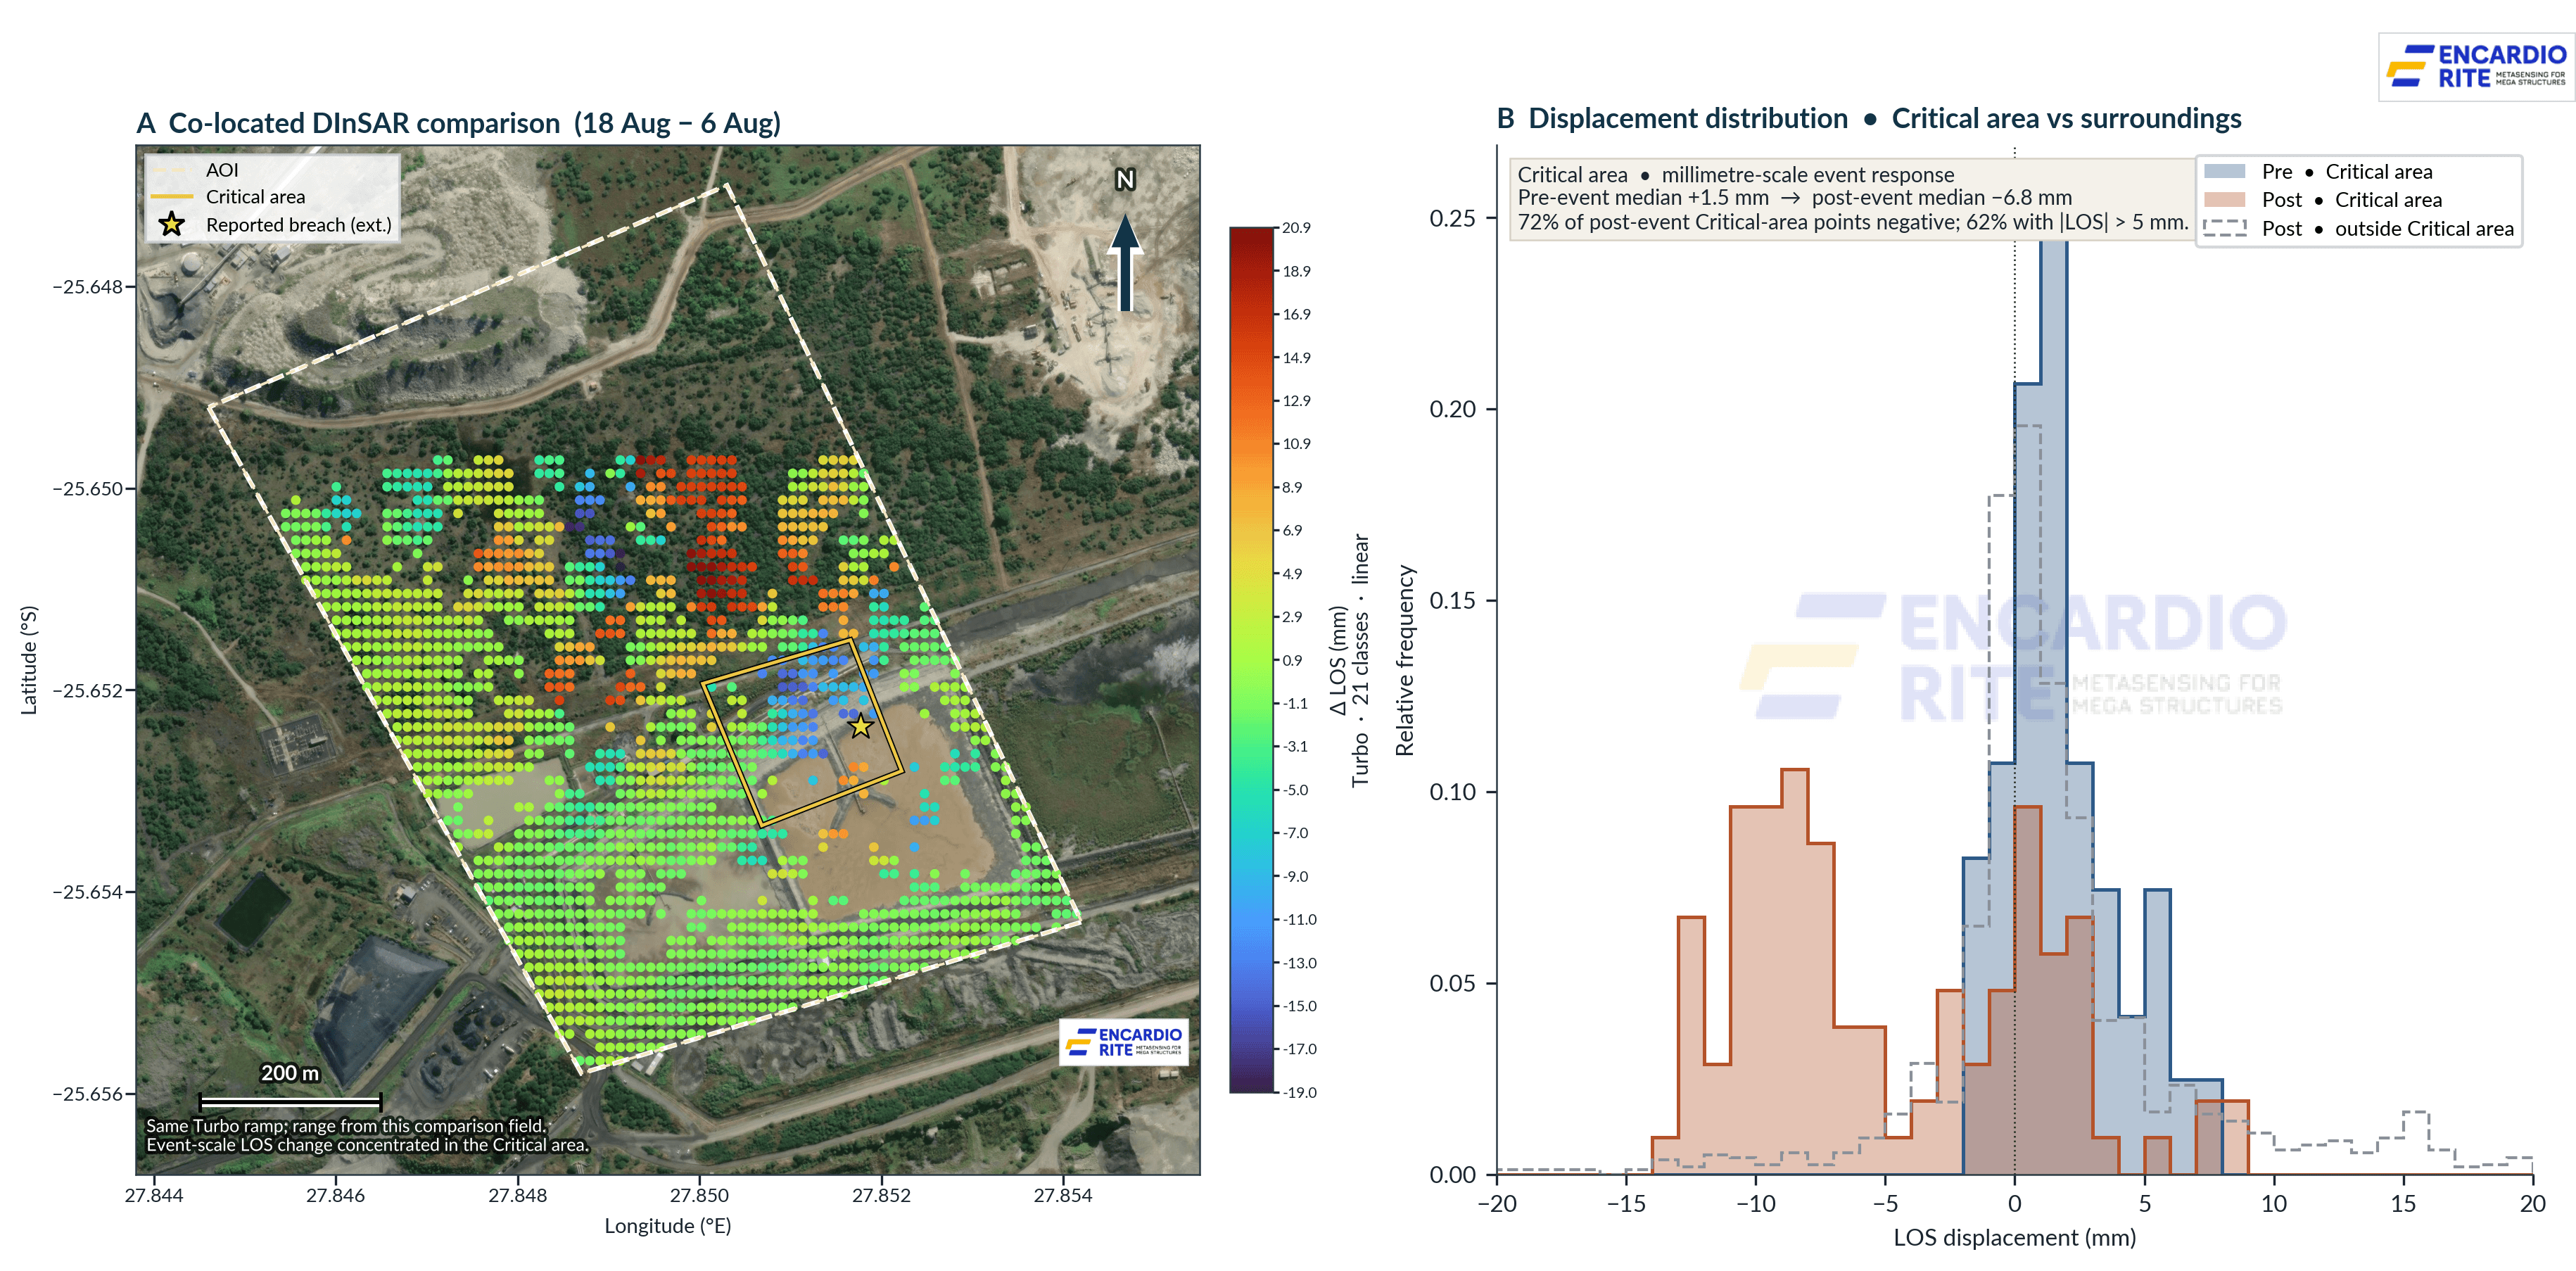
Caption: Before the failure, most readings clustered around zero normal, stable ground. After, the entire pattern shifts. This isn't a couple of odd readings; it's the whole area behaving differently, all at once.
This case does not demonstrate a standalone failure-prediction capability. What it demonstrates is the value of wide-area, repeatable satellite screening as the starting point for a rigorous monitoring programme, one where SkyWatch identifies the area of concern, and PulseCheck and DeepDive then provide the targeted ground validation and deep instrumentation that complete the picture.
For tailings storage facilities specifically, and for large asset portfolios more broadly, the combination of satellite observation and in-situ instrumentation is stronger than either alone. This case study shows what becomes visible from space and why that visibility matters.
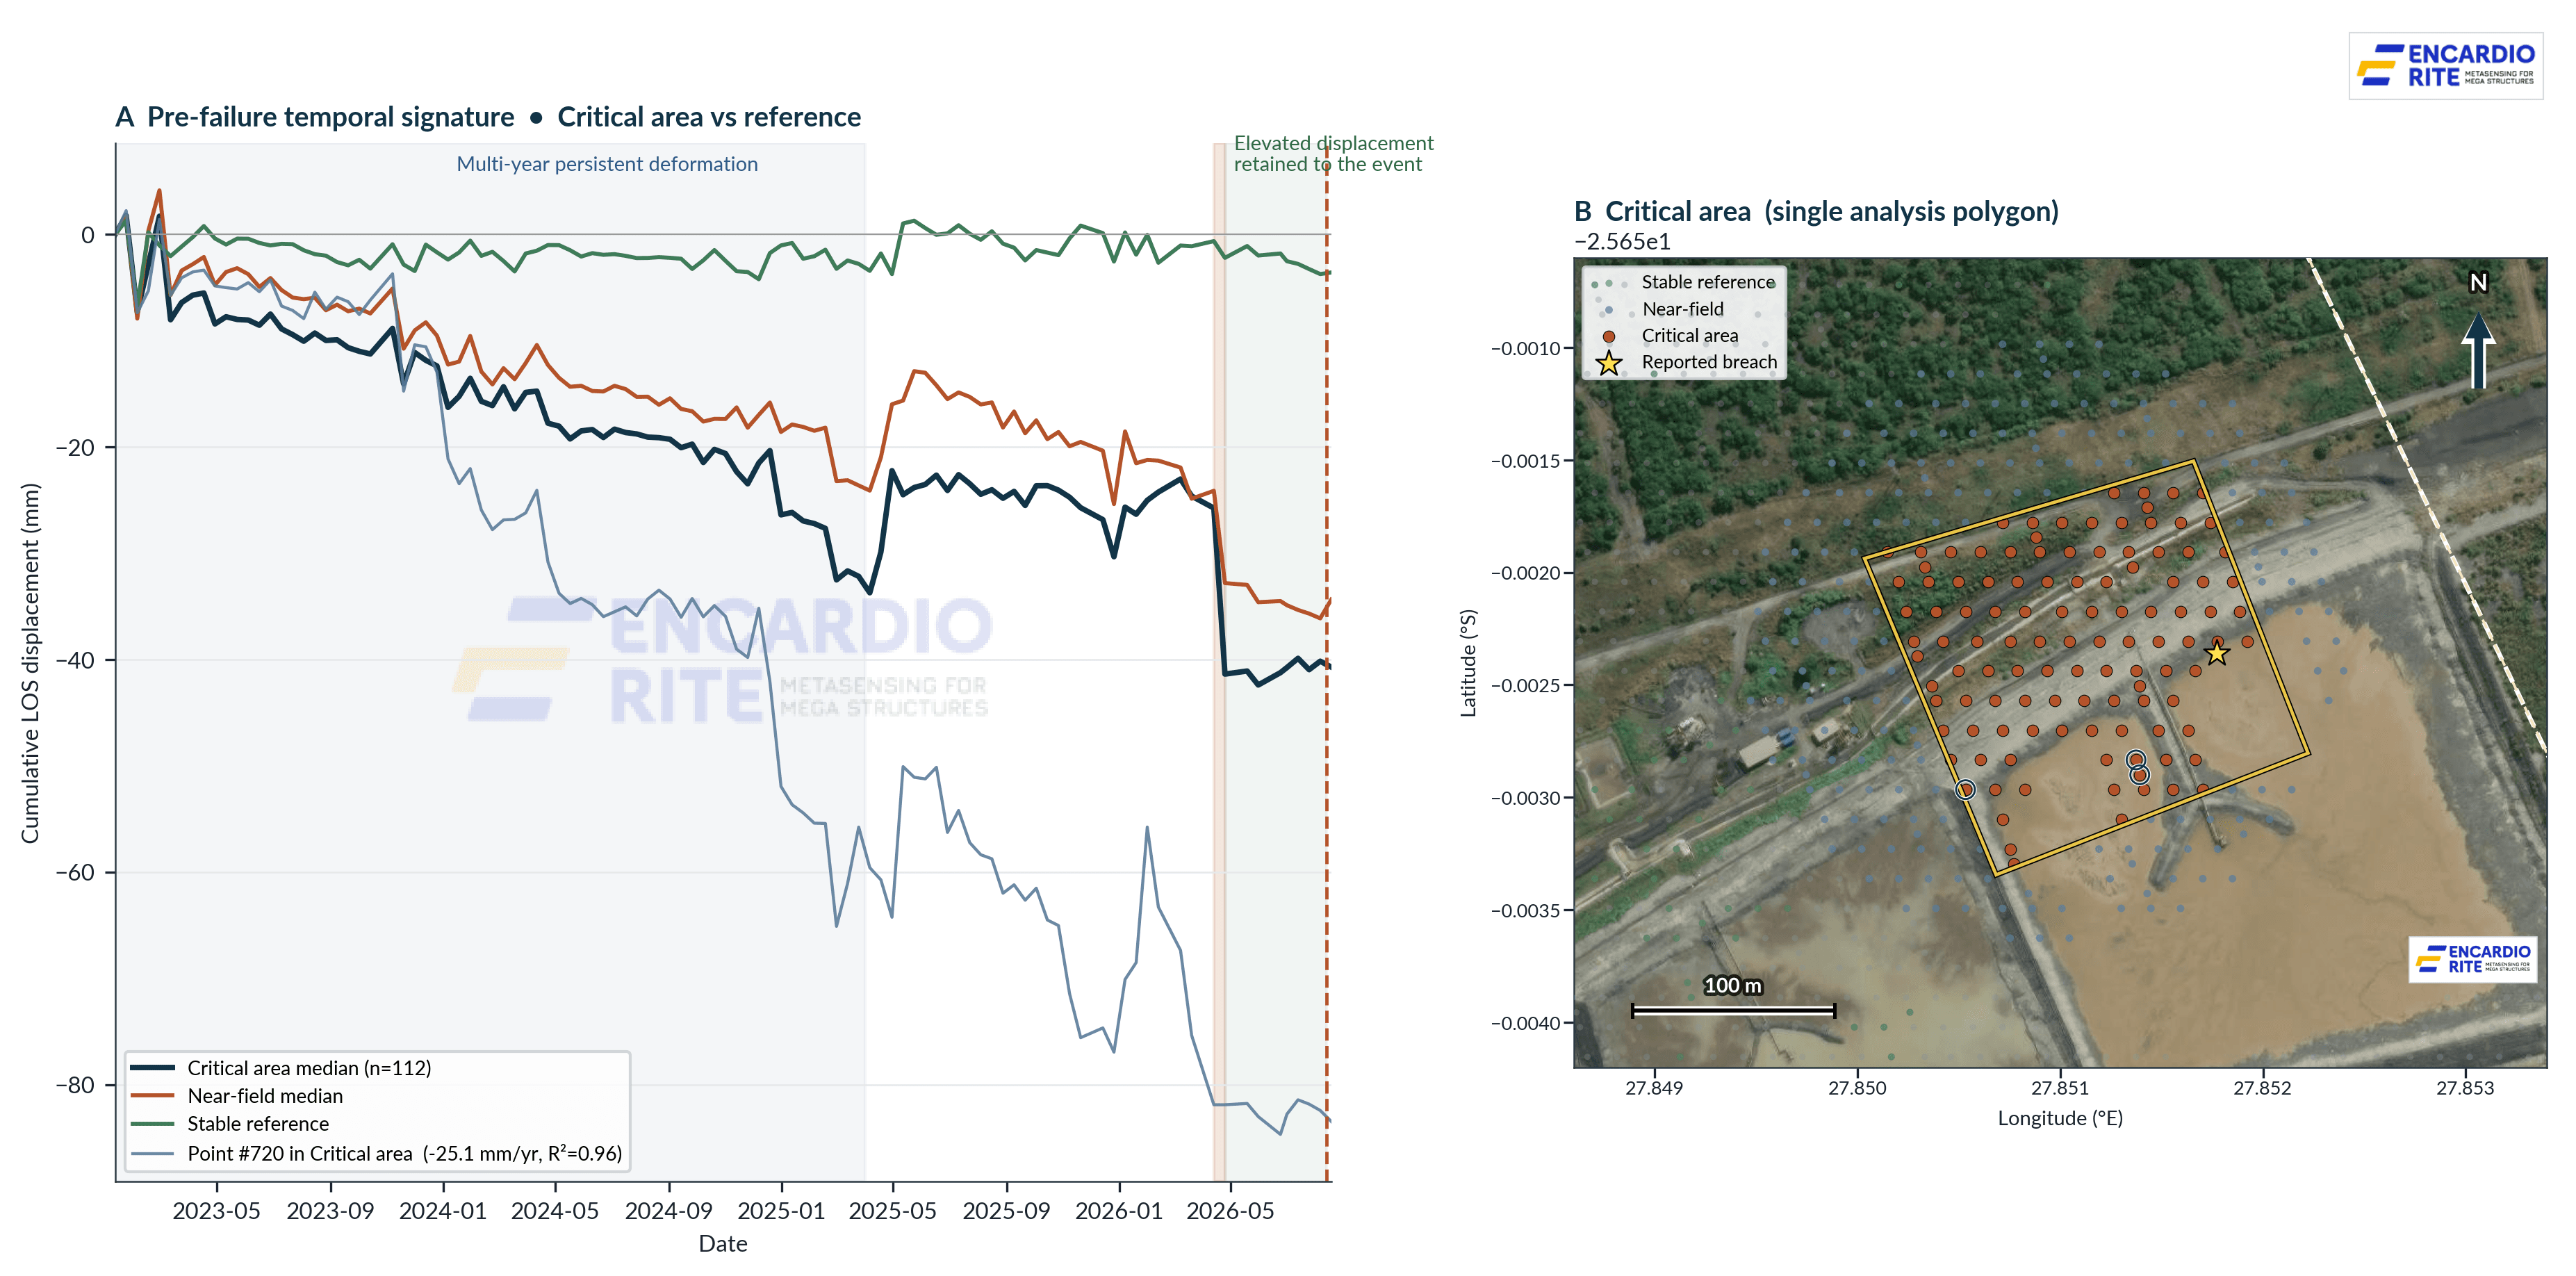
Caption: This single point moved over 8 centimetres in three years and it sits just 71 metres from where the wall failed. If you were looking for the epicentre of this story, this is it.
Figures available
Long-term SBAS deformation time series: January 2023 – August 2026, critical area vs stable reference
April 2026 behaviour-change view: -15.6 mm step and persistence
April 2026 spatial deformation map: ΔLOS concentration on the facility
Failure-window DInSAR comparison: 6 August vs 18 August
Pre- and post-event Sentinel-2 optical imagery